Class Photo Project inspired by @KC_Adams_art

This past weekend I read the KC Adams art book Perception: A Photo Series. I was prompted to read it from a “further reading” list in the book Resurgence: Engaging With Indigenous Narratives and Cultural Expressions In and Beyond the Classroom from our teacher-librarian book club.

“Tired of reading negative and disparaging remarks directed at Indigenous people of Winnipeg in the press and social media, local artist KC Adams creates a body of work that documents another perspective.
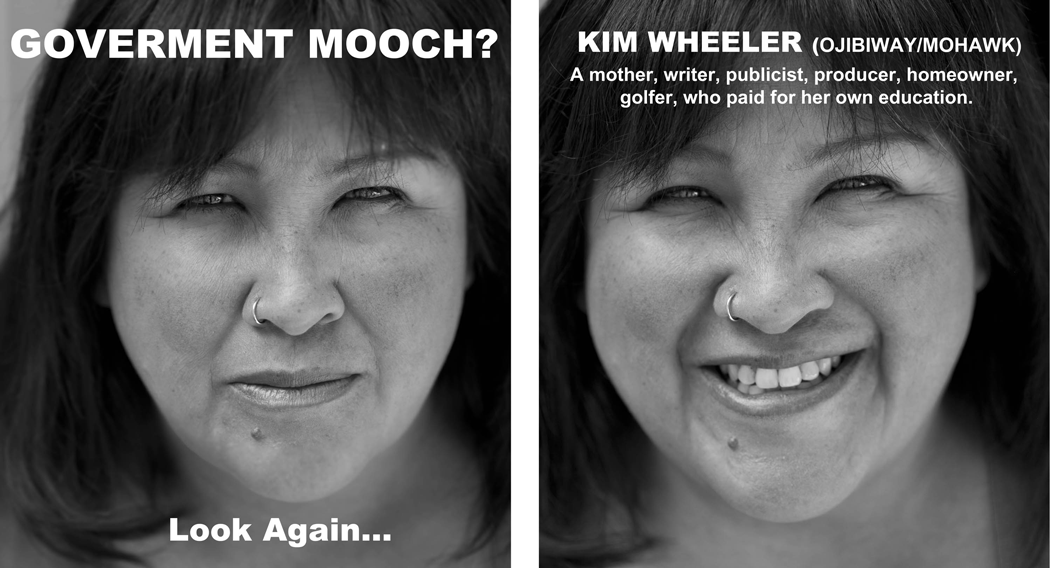
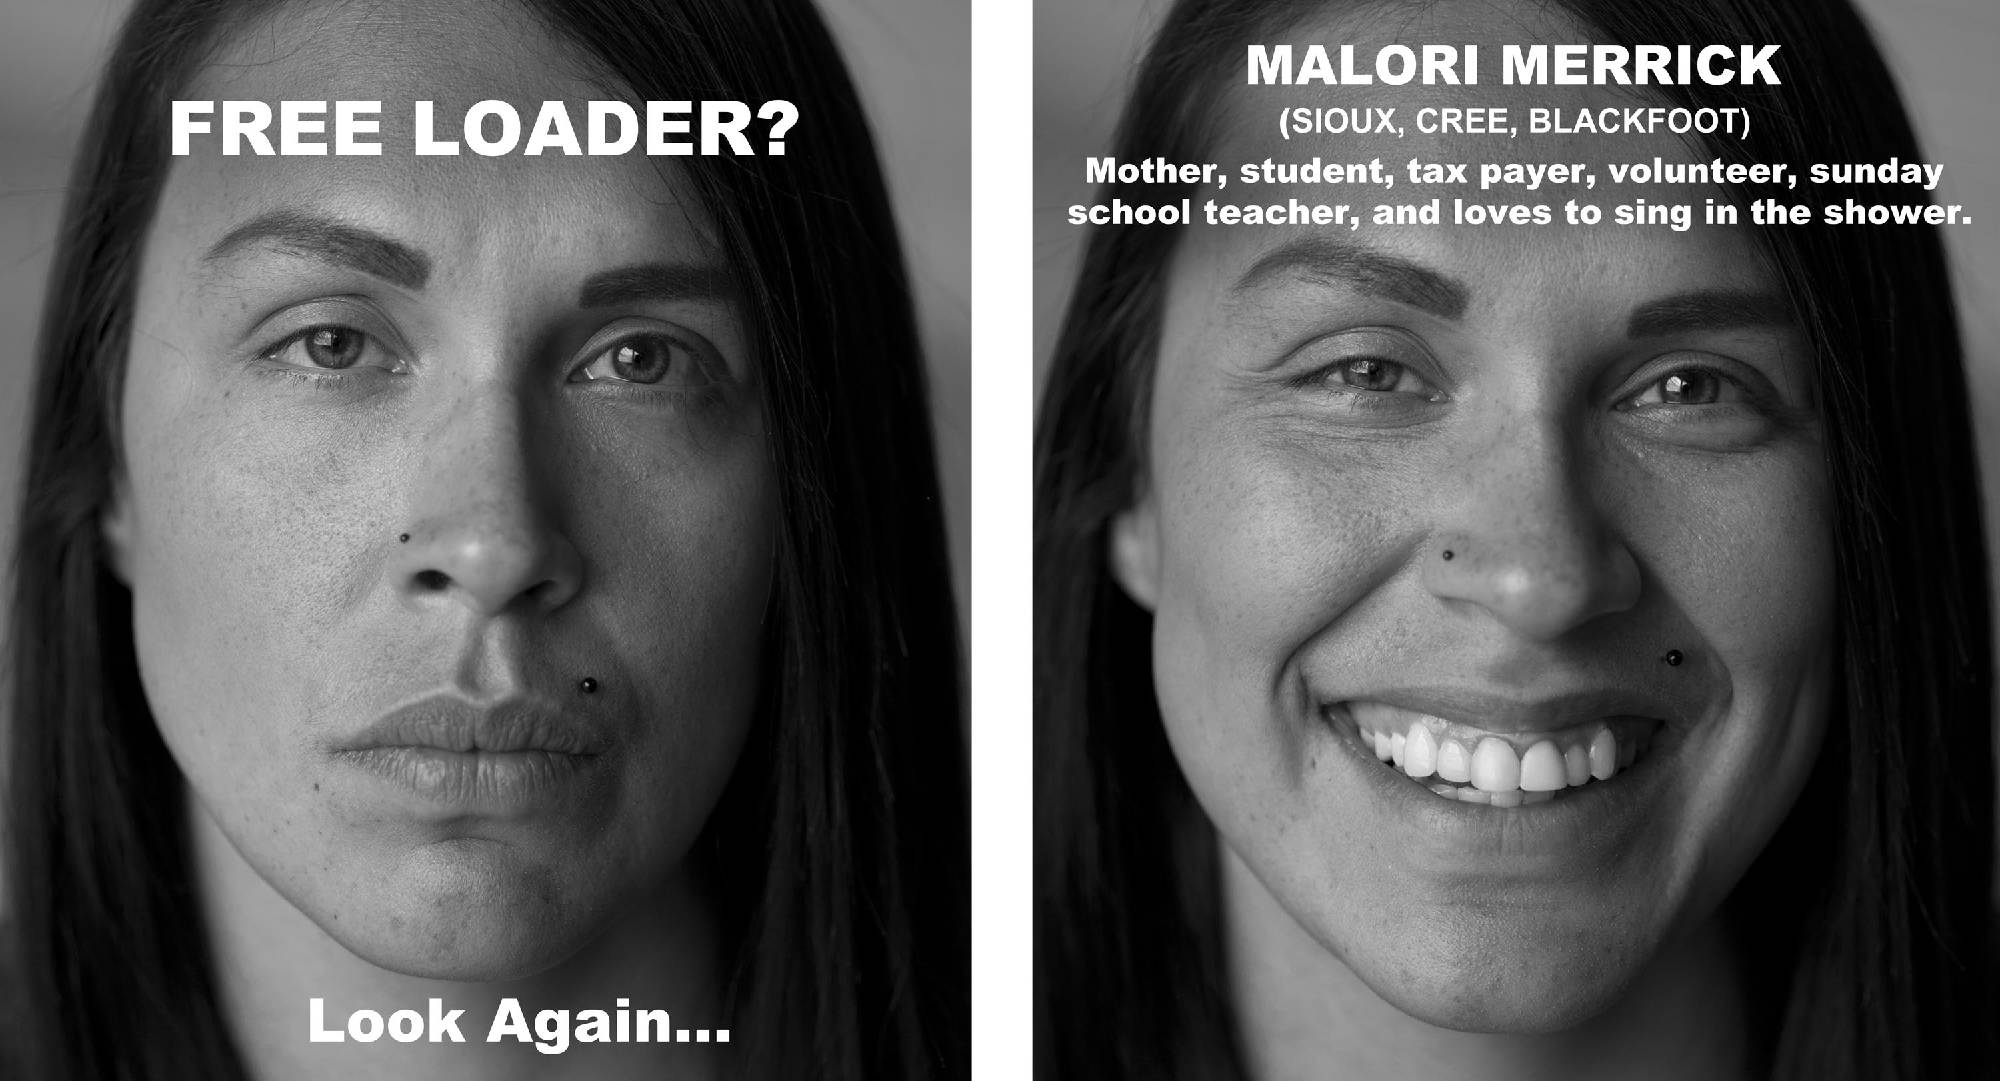
This photo series called “Perception,” is an attempt to combat the stereotypes some of the public have of First Nation, Inuit and Metis people to illustrate, you can’t judge a book by its cover.
In the first photo, the models were asked to think about racist remarks they or their family have experienced such as the text written on the title of their photo. In the second photo, they were asked to think about a family member or a happy moment in their life and write their own self-identifying title
“I always felt that there were so many Indigenous People in Winnipeg who were leaders in their community and living normal or average lives. However their stories never made it into the newspapers or on social media. Then the scandal with Mayoral candidate Gord Steeve’s wife Lorrie Steeves broke in the media and I realized that racism is very much alive in Winnipeg. I decided to ask models to pose for me and offer them a chance to label themselves”. — KC Adams #perception — in Winnipeg, Manitoba.” Source

http://www.kcadams.net/art/photography/PERCEPTION.html

I was immediately struck by how this photo essay format could be emulated with students for any social justice issue being studied in a variety of classes. One would start by reading the book to the class – there are some great introductory essays that really set the tone of the project at the beginning of the book. Then look through all the photo sets, asking some discussion questions to really analyse the format of the photo sets, the words & terms chosen, the pattern used, the messaging, etc.

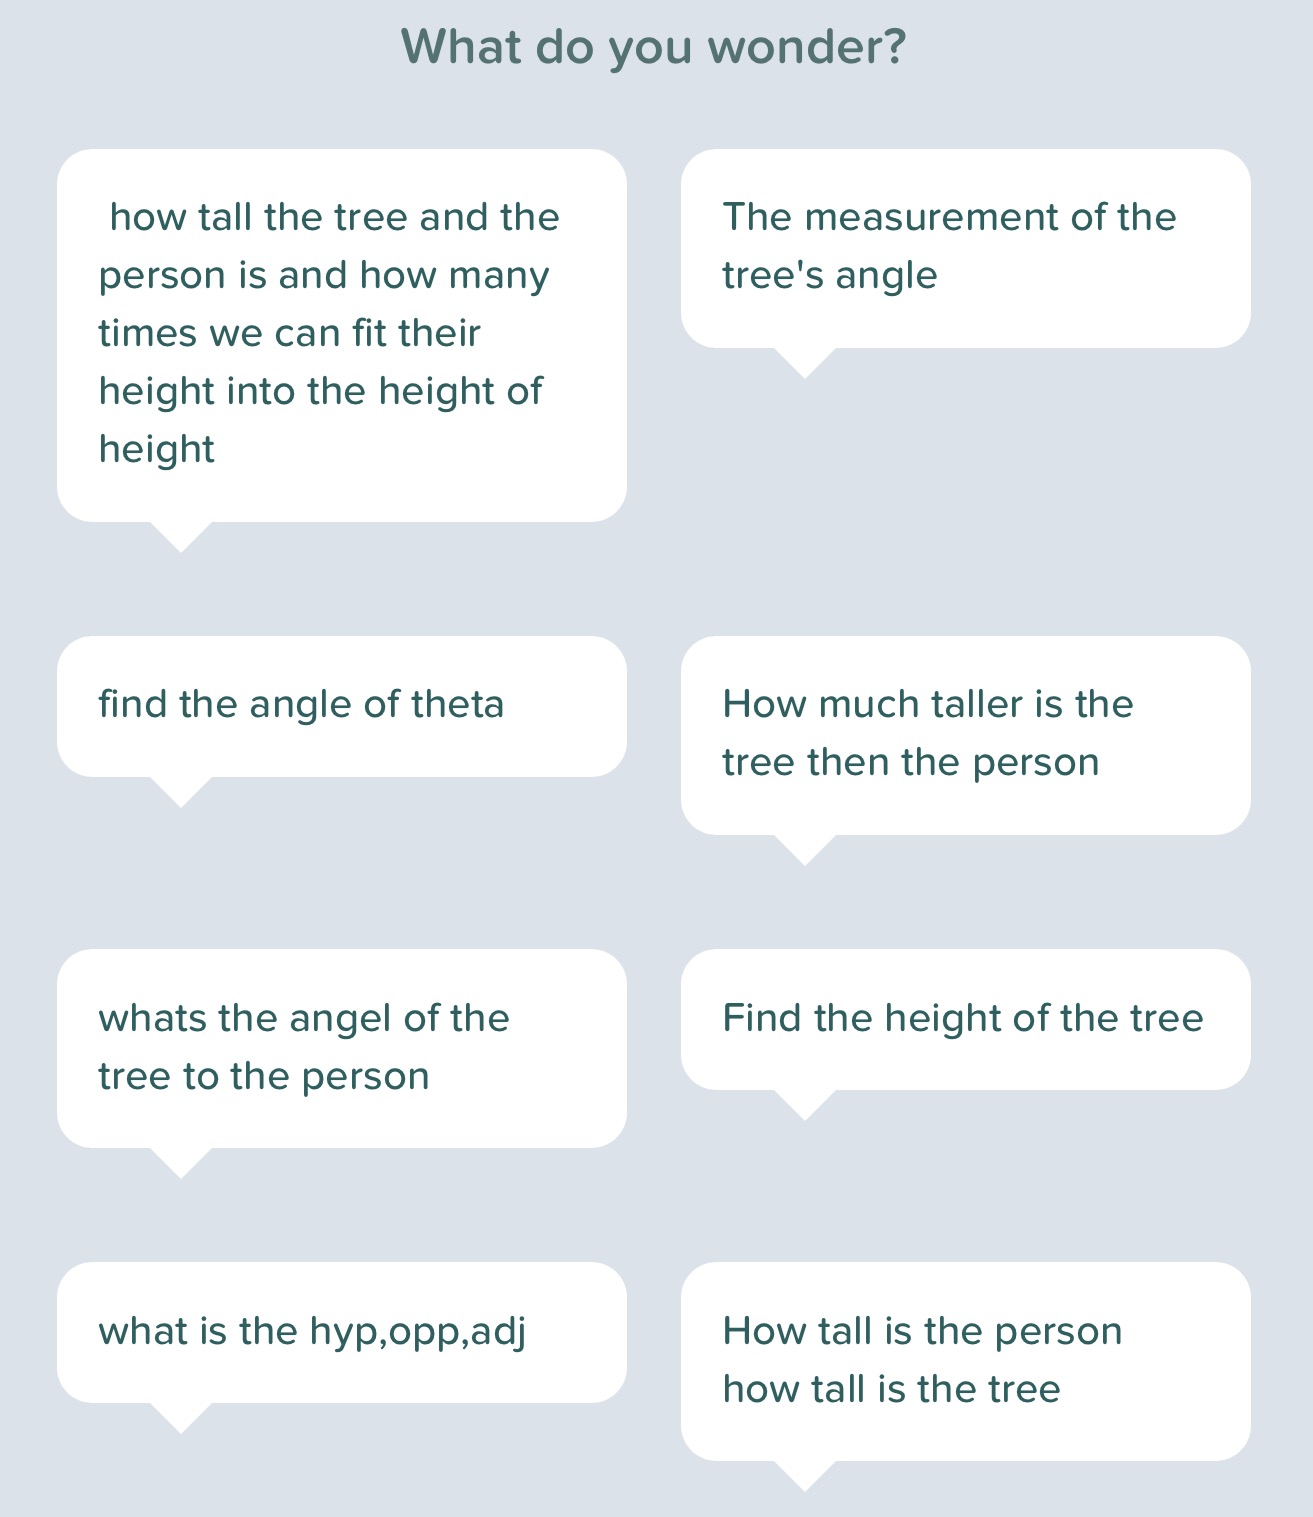
Then students would choose a social justice issue that they would like to explore (& related to the course) and start to plan who they might photograph for their models. I made a 1-pager that students could use to plan out each photo set:

Document available here

One would want to reach out to KC Adams before starting the project to ensure they are comfortable with students emulating the format in class. I could also see this format being used for more light-hearted comparisons or even objects with no social justice connotation (stereotypes about Canadian provinces in grade 9 geography maybe) but would absolutely want to check with the artist before taking it in that direction.

Would you try this with your class?
Either way I highly recommend this book – I borrowed it from the public library. Being mostly photos, it’s a quick read.

– Laura Wheeler (Teacher @ Ridgemont High School, OCDSB; Ottawa, ON)

Lesson Planning Template

I saw this tweet & thought it would make a great intro to a blog post about lesson plan templates:

followed by this in the thread also:

I also love this Cult of Pedagogy article by Norman Eng about the one-sentence lesson plan:

In the beginning of my career I spent many hours every evening creating lengthy notes to use with my students. These days, a lot of my lesson planning happens on the drive to work. Thinking through what I want to get to that day with each class & then putting the necessary resources together once at school.

For long-range planning I like to print a full semester calendar on 1 sheet of paper for each of my courses so I can map out the progression of our learning:

But in the case where one does need to create a more fulsome lesson plan – including when I asked my teacher candidate students at uOttawa to create one for an assignment – here’s the template I made & offered them:

How short or long are your lesson plans? How has your lesson planning evolved over the course of your career? Do you have a template you swear by? Do you write anything down? Leave a comment below!

– Laura Wheeler (Teacher @ Ridgemont High School, OCDSB; Ottawa, ON)

#LearningInTheLoo: Podcasts

I’ve been pretty quiet on here as it’s been a busy semester. We sold our house & moved full time to our cottage (giving us a longer drive in to work each day). I’m almost full time as teacher-librarian now & learning this new role consumes my days. And I’ve been working at establishing a better work-life balance so haven’t been doing teachery things in the evening as much as possible.

It was high time for a new edition of Learning in the Loo. This one is all about podcasts. With my long drive to & from work I listen to a lot of talk radio and podcasts. I often hear stories that give me lesson ideas or make me think “that would be great for a [fill in the blank with a subject area] class!”. So these can be great for your personal learning. But these could also be used with students, having them listen to a clip on a certain topic as an introduction to an activity, or perhaps as a listening activity in and of itself.

Learning in the Loo.png

If you’d like to use podcasts with your students but are wondering what that might look like, maybe read what some of these teachers have tried:

USING PODCASTS IN THE CLASSROOM by Ashley Marquez

Teaching the Art of Listening: How to Use Podcasts in the Classroom by Alix Mammina
(also touches on how to go the next step & get your students podcasting about local events/issues)

How Podcasts Can Improve Literacy in the Classroom by Michael Godsey
(talks about using the transcript text to allow students to read along with what they are listening to)

Past editions of Learning in the Loo can be found here.

– Laura Wheeler (Teacher @ Ridgemont High School, OCDSB; Ottawa, ON)

Bank Balance problem

A few weeks ago I was ready to do my first Linear Systems of Equations problem with my MFM2P grade 10 applied class. The first step is to get them to solve systems graphically (a review of gr9 essentially) and interpret the solution. The last few times I did that topic, I used a scenario of a race between a runner and a dog-walker w/ a head start; where/when do they meet? It’s always complicated and requires more hints from me than I’d like. So I decided to design a new scenario – something that would allow us to practice our linear relation skills at the same time. I came up with this scenario of 2 different bank account balances as they grow over time:

Screenshot 2019-03-19 at 2.56.46 PM

  1. Presented with the above data, we worked through our notice & wonder routine using Pear Deck.
  2. Then I showed them the question I had for them:
    “When will they have the same bank balance on the same day?”
    Students estimated how many days before that would happen via Pear Deck.
  3. Then we had turn & talk time with our visibly randomly grouped (VRG) partners to discuss what we should measure, look up, and/or calculate in order to solve the problem. We shared our thoughts to the whole group.
  4. Then I sent students to their group’s board (VNPS) to solve the problem in any way they saw fit. Periodically when the majority of groups seemed either stuck, or ready for it, I called them all over around some board space to do some direct teaching. The things I called them over to talk about at different moments:
    – first differences & whether or not each table is linear
    Desmos: plot the tables
    – Desmos: linear regression for line of best fit
    Asked them to sketch their graph from Desmos on their board.
    Here are their boards:
  5. We had a follow up day where I walked them through interpreting a couple of different graphs of system of equation scenarios.

The whole activity is available in this slidedeck that has added Pear Deck interactivity if you use their add-on.

– Laura Wheeler (Teacher @ Ridgemont High School, OCDSB; Ottawa, ON)

Great Canadian Mail Race – “Dear any grade 9 student …”

This spring I got an envelope in my mailbox in the main office addressed to “any grade 9 student”. At first I was unsure as to why the office staff chose to direct it my way; likely because I work with the Link Crew students who, in turn, work with our grade 9 students to help them transition to high school. I opened the envelope to find a handwritten letter from a grade 9 student named Jeremy in Langley, BC. The enclosed typed letter from Jeremy’s teacher explained that this was part of an activity she called The Great Canadian Mail Race. She explained how it works in her letter & I did a quick Google search to discover that it’s been around since at least 2013. Very cool – how had I not heard of this before?

20180425_111725-01.jpeg

I decided this would make a great assignment for my grade 9 BTT1O/S class; Information and Communication Technology in Business. They could type up letters to send around the country using Google Docs. So I read Jeremy’s letter out loud to the class. I then gave each of my students a quarter sheet of paper to write a short response to him. We put all of our responses together in an envelope & mailed that off to Jeremy:
20180426_104338-01.jpeg

Next up, I had my students – in pairs – choose a different province & territory. Within each pair, one student picked a big city and one student picked a small town in their chosen province/territory. I told them they couldn’t pick Ottawa (our town) but next time I would say no Ontario at all – because it meant that with the number of students I had. we left out Newfoundland & Labrador. Each student picked a high school in their chosen city/town.

I made this map of the locations we picked for the purposes of this blog post. Next time I’ll have the class collaboratively build this map in Google My Maps:Capture.PNG

I gave students a day to read up about their chosen city/town and the school they had selected. Then my students began composing their letters in Google Docs. The previous week we had learned about composing a proper email message and each wrote a proper email to somebody. We started these letters by discussing as a group what the format of a typed letter should be. We made a sort of template to follow on the whiteboard & students began writing their letters. For many of my students this was their first experience with writing a letter (as it had been composing an email longer than a sentence or two also).

Once they had a rough draft, I had them draw a random name of a classmate and share their doc with that person to be peer-edited/reviewed. We do this by sharing our docs in “comment only” mode. They leave a positive comment as well as something for the person to improve. Then each student returns to their own doc for a final edit.

Once all of our letters were ready to go, we printed each one and wrote something by hand or drew on our letter to make it a little more personal. Each student addressed the envelope for their letter. This was a learning experience in and of itself. Many students were unsure what to write where, how or where to find the proper mailing address for the school online, etc. Lots of learning happened here.

20180515_093037-01.jpeg

I also typed up a letter that I photocopied & had students include with theirs in their envelope. It read:

Dear Teacher,
My students are writing to you today as part of the Great Canadian Mail Race. A few weeks ago we received a letter from a grade 9 student in BC. We read that letter and each student responded with a short hand-written note that we then mailed back all together.
Today we are sending out new typed letters as part of our BTT1O/S course; Information and Communication Technology in Business. I am evaluating their ability to work in Google Docs as they write their letter. We have arranged it so that we are sending one letter to a small town and one letter to a big city in each of the provinces & territories in Canada. The first person to receive a letter back in the mail will win the race!
We are a very diverse school in Ottawa, Ontario. Some of the students in my class are ESL or even ELD students. ESL students are learning English as a second language. Our ELD students have had significant schooling gaps in their life, and are not yet literate in their native language, let alone in English. They have done their best to write their letters as clearly as possible.
I hope you’ll consider continuing the Great Canadian Mail Race with your class; it’s been a fun experience for us. For some of my students this was the first time they have ever written a letter to someone. Perhaps it will be a first opportunity for some of your students as well. We hope you’ll read this letter with your students and encourage them to respond in kind.
Sincerely,

Here are our stuffed envelopes ready to get stamped in the main office & be sent out in tomorrow’s mail!

20180515_154758-01.jpeg

I can’t wait for letters to start coming back to my students. I know that when they wrote their emails the other week to past teachers, family members, and city councilors they thought it was pretty neat to get back & read the emails they received in return.

This has been a great activity so far. A genuine way to have students create something in Google Docs that we can send out into the real world (a tech skill I have to evaluate for this course anyway). Don’t wait to receive a letter, start the mail chain yourself by having your students write a letter to any grade ___ student elsewhere in our beautiful country. Teaching a course on global studies? Have students pick various countries outside Canada instead.

If you try this activity or have done it in the past please leave a comment below about what you did differently, things that went well, and what you’d change next time so that we can all learn from each other!

– Laura Wheeler (Teacher @ Ridgemont High School, OCDSB; Ottawa, ON)

#LearningInTheLoo – #HourOfCode

Hour of code is next week so I decided to make a new Learning In the Loo poster about the event & why a teacher might want to participate. A big thank-you to Sylvia Duckworth & Brian Aspinall for allowing me to include their great list of reasons to teach coding in sketchnote form:

Learning in the Loo.png

Want to share some Learning In The Loo posters at your school? Here are my archives!

– Laura Wheeler (Teacher @ Ridgemont High School, OCDSB; Ottawa, ON)

Pumpkin Challenge #3ActMath #MFM2P

It all started with a trip to the grocery store where I noticed a giant pumpkin on display & a prize of $50 in gift certificates if you could guess the weight of the pumpkin:20171012_160744-01

I went back a couple of days later to take some measurements of the giant pumpkin, bought 4 smaller pumpkins of varying sizes & we were on our way!

Day 1

Act 1

What do you know / notice?Screenshot 2017-10-26 at 5.49.51 PM

What do you wonder?Screenshot 2017-10-26 at 5.51.09 PM

Estimate the weight of the pumpkin in pounds:
I passed around a 1lb bag of barley that all the student We start with a guess that’s too high (but not silly like 5000 lbs), then too low (but not silly like 1 lb). Then they make their best estimate:Screenshot 2017-10-26 at 5.53.37 PM.png

Then I have them do a turn & talk with their group (visibly random groups of 3) to discuss what they need to a) measure, b) Google c) calculate in order to solve this problem.

Students made a prediction about which characteristic of the pumpkin the weight would depend on most:Screenshot 2017-10-26 at 6.52.09 PM.png

Act 2: 

I revealed some measurements I’d taken of the giant pumpkin:Dimensions

We had 4 pumpkins of various sizes at stations around the room with a scale to measure weight and rulers & measuring tapes. Groups were sent to their vertical non-permanent surfaces to begin collecting & recording data about any measurements they thought they might need for the pumpkins to help predict the giant’s weight:

Groups recorded measurements and started calculations for volume, etc. in order predict the giant pumpkin’s weight:20171018_143719

At this point we hit the end of the class period. Some groups had some volume calculations but none of them had got to (or really thought of) creating a table or a graph of weight depending on another variable to make a prediction.

Day 2

I was away this day & so students had the period to do some independent practice on Volume & Surface area word problems on Khan Academy.

Day 3

I wanted students to graph weight VS diameter, weight VS surface area, & weight VS volume. So I created a Desmos Activity to walk them through that process:Screenshot 2017-10-27 at 10.57.39 AM.png

I provided students with the raw data they would need (as they had already worked on these types of SA & Volume calculations the previous period – today’s learning goal was all about the linear & quadratic relations between different variables):Screenshot 2017-10-27 at 11.00.16 AM

They found the line of best fit and quadratic curve of best fit. We had a class discussion about which one fit the data better … quadratic!Screenshot 2017-10-27 at 11.03.29 AM

They they used that curve to predict the weight of the giant pumpkin based on diameter:Screenshot 2017-10-27 at 11.05.01 AM

I walked them through that first set of tasks step by step as a whole class making sure everyone understood. Then I turned the Desmos Activity to student-paced mode & let them continue the same graphing tasks for weight VS surface area & then volume (although many of my students gave up working on it once I was no longer leading the class through the activity slide by slide).

Each student had filled out an entry slip for the pumpkin contest at the end of day 1, and I allowed them to adjust their entry if they wanted based on today’s work. I then dropped off all of their entries after school:
Screenshot 2017-10-27 at 11.25.46 AM

Day 4

Started class by revealing the weight of the giant pumpkin.
DRUM ROLL PLEASE . . . 166 pounds!!!

I then presented them with a the 3 models we created, each showing the giant pumpkin’s actual weight as an orange dot & asked which model was the best predictor for the giant pumpkin:Choose a modelScreenshot 2017-10-27 at 11.42.02 AM

I finished by having the students drag dots to any Math from our course that we used over the last few days with this activity:Screenshot 2017-10-27 at 11.44.23 AM

Students had the rest of the period to do some individual practice on “Graphing linear functions word problems” on Khan Academy.

My folder with everything for this activity can be found here. The unassociated files are the Pear Deck interactive slide decks.

– Laura Wheeler (Teacher @ Ridgemont High School, OCDSB; Ottawa, ON)

Banquet Hall problem #MFM2P #PBL

This is my 2nd or 3rd time doing this activity, but hadn’t yet blogged about it. So here goes … I made lots of changes, even from one period to the next.

Prompt:Spartan Banquet Hall.png

Notice-Wonder-Estimate:

Screenshot 2017-10-13 at 3.38.20 PM.png

Screenshot 2017-10-13 at 3.39.27 PM

Screenshot 2017-10-13 at 3.40.35 PM

Solve:
At your boards (whiteboard / chalkboard) in groups of 2-3 randomly assigned (VNPS & VRG).

Most groups started calculating the cost per person for each teacher. I stressed to them multiple times that all 3 teachers were paying along the same formula or “price plan”. They really struggled with how that could be. In first period there was 1 group whose board had a table on it & they had started using 1st differences to calculate the rate of change. I called all the groups over & led a discussion about the strategy and asked about what sort of deposit (a cost for 0 people) might have to be made by the teachers & sent all the groups back to continue, strongly urging them to explore the table idea. In 3rd period, none of the groups started the table, so I called all the groups over to some spare board & said “here’s something I saw in 1st period” & proceeded to have the same conversation with them.

Here are their boards:

This slideshow requires JavaScript.

We got to the point on day 1 where everyone solved for the cost for 150 guests. Time ran out, & bell rung.

Between periods 1 & 3 today I added some extra slides & questions to my slide deck to make it better.

Day 2:

Yesterday I added a slide asking students to graph the 3 points from the original data set in the original prompt. Today we started on that slide in Pear Deck :Screenshot 2017-10-13 at 3.54.27 PM.png
I asked them if this was linear or nonlinear. Why? In 1st period this also resulted in a conversation about 1st differences when the x values don’t have a constant increase.
I asked if the line of best fit would pass through the origin?

I then sent groups to their boards with the task of using Desmos to find the equation for the line of best fit . Their boards:

This slideshow requires JavaScript.

Once they had done a linear regression to find the equation, I asked them to use their equation to solve for the number of guests I invited if my party cost $3545 at the banquet hall. I coached a few groups through the proper format in which to show their work when solving an equation.

The rest of the period was dedicated to individual practice on a Khan Academy problem set called “Slope intercept equation from graph“.

Find the whole lesson here (the unassociated file is Pear Deck).

As a final note, this whole problem-based teaching can be hard for the student to grasp sometimes. Today this happened:

How do you handle it when students question your teaching skills or pedagogy? Let me know in the comments below!

– Laura Wheeler (Teacher @ Ridgemont High School, OCDSB; Ottawa, ON)


Running VS Walking Headstart #MPM1D #MFM2P #3ActMath

A month ago or so I read a post by Mr. Hogg about his Fast Walker activity. I thought it would be a great way to introduce linear systems graphically to my combined grade 9 math class before the end of the semester. I also did this activity with my Grade 10 applied students – next semester I’ll use it as an introduction to systems graphically with them earlier in the course.

What turned out to be super awesome is that a student in my grade 9 class just won gold at OFSAA last week! So I tweaked Mr. Hogg’s activity to use Joe’s winning data in our problem. I also structured the activity to be a 3 act math task. Here’s what we did:

Act 1: Notice – Wonder – Estimate

Runner Speed (1)

What do you know / notice?Capture

What do you wonder?Capture

If you want to cross the finish line at the same time as Joe, what distance head start will you need?Capture.JPG

Act 2: Measure & Solve

Capture.JPG

Students were told they had to stay in class when taking measurements; my idea being to force them to time themselves walking over shorter distances (the length of our classroom) and then use that to model their speed for this problem given. Each student had to calculate their own head start:

This slideshow requires JavaScript.

Act 3: Check & Reflect

We went out to our 400m track and students measured out their starting position. They staggered themselves according to their calculation (photo below – tried to take video but my phone battery died). Most students were around 100m before the finish line (~300m head start). We counted down & Joe started running & the class started walking. I so wish I’d gotten the video because it was awesome how close they all finished to each other!DB6mp2rXgAE8O55

I had my grade 9s graph their walk & Joe’s run on the same grid. Here are their graphs overlaid on top of each other:
Capture
Most students had the right idea, and I talked to a few with incorrect graphs individually but when I look at this overlay now I can see that I missed helping a few students correct their work 😦

We discussed which line was partial variation & which one was direct. I then introduced the language of “linear system” and “point of intersection”. My 2P class time to create an equation for each line also.

The next time I try this, I’d like to add an individual follow up question such as if you only had a 50m head start, at what distance would you & Joe meet? At what time would that be?

Here are my files for this activity (the unassociated one is the Pear Deck slideshow).

Tech Tip: Did you know you can add the same Google Doc/file to multiple folders without copying it? I didn’t until recently. It was useful for this lesson because I wanted to have it in the folder for each of the 2 classes I did the lesson with! Once you’ve clicked on the file just press Shift+Z :Capture.JPG

– Laura Wheeler (Teacher @ Ridgemont High School, OCDSB; Ottawa, ON)

Tree Height #3ActMath #MPM2D #MFM2P

Here is a tree height 3 act math activity I do for right angled trigonometry with both my 2D & 2P classes. The screenshots below were taken from my 2P class this semester.

Act 1: Setup

IMG_1636

Some noticings:IMG_2298

Some wonderings:IMG_2299

We do some turn & talk guesses for “too low” & “too high” then we go back to Pear Deck for our best estimate:IMG_2300

Act 2: Measure & Solve

Students downloaded a clinometer app onto one of the phones in their group.

Here are photos of last year’s group out measuring:

Up to the “vertical non-permanent surfaces” to solve in their “visibly random groups”:

This slideshow requires JavaScript.

Act 3: Consolidation

This is one activity I don’t have a true act 3 for – I don’t know the actual height of this tree 😦 I led a class discussion going over the solutions from various groups. We discussed the fact that trig would not find the whole tree height & that groups needed to add the height of the person up to eye level to their value found using trig. I sent groups back to their boards to adjust their solution for this (final photos above).

The whole activity, including the Pear Deck file, can be found here.

– Laura Wheeler (Teacher @ Ridgemont High School, OCDSB; Ottawa, ON)