While I’m not technically participating in the Explore MTBoS blogging initiative, I have been reading others’ posts & liked this idea of writing about “my favourite” something. I also realised that I haven’t ever posted about the ways I incorporate Desmos into my class except in passing when describing the activities we’ve done in class. So here is a list of the ways I use & love Desmos w/ my students:

New sketchnote created 2016.11.03
Basic Graphing & Solving Problems
Here’s an expectation from my grade 10 applied math class: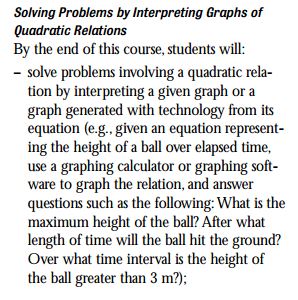
The old way: Graph by hand by making a table of values & interpret the graph. Or learn the more difficult algebra for solving for zeros, etc.
The Desmos way: Use Desmos to graph the equation given & identify key points in order to solve problems such as maximum height, landing distance, etc.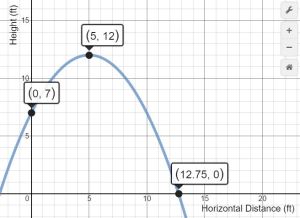
Investigating with Desmos:
Here is an example of a curriculum expectation for my grade 10 academic math class: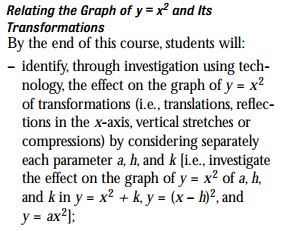
The old way:
– Draw graphs of many different equations by hand to compare & conclude
– Use school-loaned TI-83 to graph multiple equations, compare & conclude
The Desmos way:
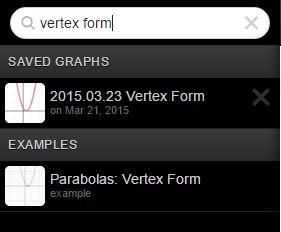
Have students use sliders to see in real time the effects of the various parameters.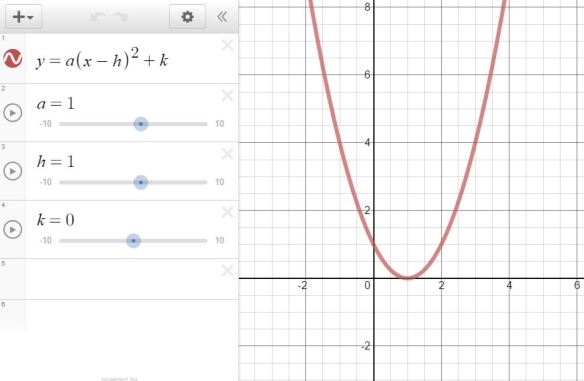 And the best part is you don’t even have to make one yourself. Just search “vertex form” in the handy dandy search bar to get a pre-made graph to use right away:
Regression Models
The old way:
In past years I was reluctant move to far towards Demos from our TI-83 graphing calculators because the TI’s regression models were useful to my students. Especially in the applied class where the focus is less on algebraic manipulation and more on understanding & problem solving, being able to use the TI-83 to find the equation given a table of values was great. However, it did require some serious steps to follow on the graphing calculator.
The Desmos way:
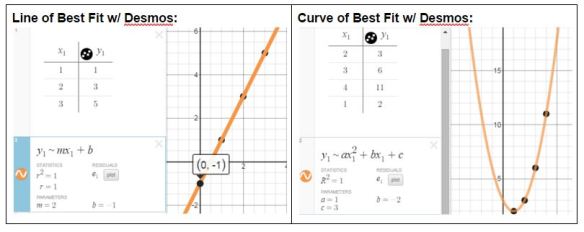
Desmos makes linear & quadratic regressions easy for my students. Input your table of values, and one line of “code” . . . et voilà! Click here for a tutorial from Desmos.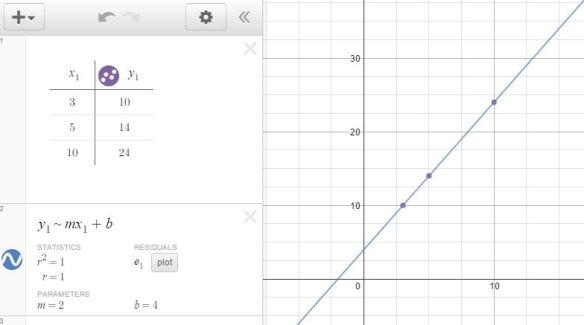
Activity Builder
Often when I do a 3 act math problem with my classes, for example a linear pattern problem, they solve using a table of values. I’m happy that they’ve selected & implemented a valid strategy. Perhaps not the most efficient, but the one that makes the most sense to them at the time. But the curriculum asks them to use a graph & equation to solve these problems.
The old way: So I used to create worksheets that asked students to draw a graph the data points, determine an equation, etc. the day after the 3 act math to ensure that we explored all the possible strategies for solving the problem. I would then do some direct teaching pointing out how the graph & equation relates to their table of value solutions so they could see the parallels between them.
The Desmos way: For years Desmos has been creating pre-built activities you can run with your classes; Polygraph, Marbleslides, etc. But new this year is that you can build your own activities with the activity builder. So I’ve been making online “worksheets” where each student can work through the activity using Desmos to create a graph and perform a regression to find the equation for the relation. Click here for a Desmos activity I created to consolidate our learning after the Toothpick Triangles activity. The dashboard allows you to see the work of each student: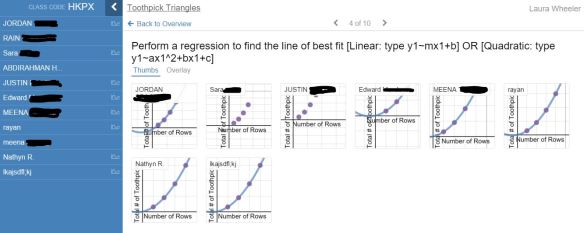
Testing with Desmos
So far this year, I’ve allowed my students their phones, a loaned iPad from me, or a loaned Chromebook from me on tests (in replacement of the TI-83 they used to be allowed during evaluations). They have to cover all camera lenses with paper & masking tape. They are supposed to only use their calculator app & the Desmos app. But I know of at least one student that has used an app that will expand/factor quadratics for her. I would be fine with that if I could make the questions harder (more critical thinking than calculation) but the course has a board-wide exam so my hands are tied.
The exam for that class will be this Friday (in 2 days). And this morning I’ve been experimenting with iOS guided access mode in which I can lock them into 1 app only (Desmos) as well as Android’s Surelock app in which I can lock them into multiple apps (calculator & Desmos) with my own password. I am thinking I will try this for the exam on Friday; no other apps, no internet access.
Have I missed any ways that you use Desmos in your classes?
Share them in the comments below.
– Laura Wheeler (Teacher @ Ridgemont High School, OCDSB; Ottawa, ON)

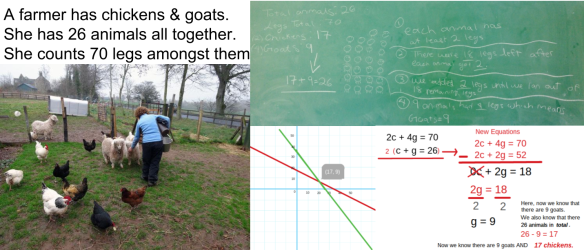
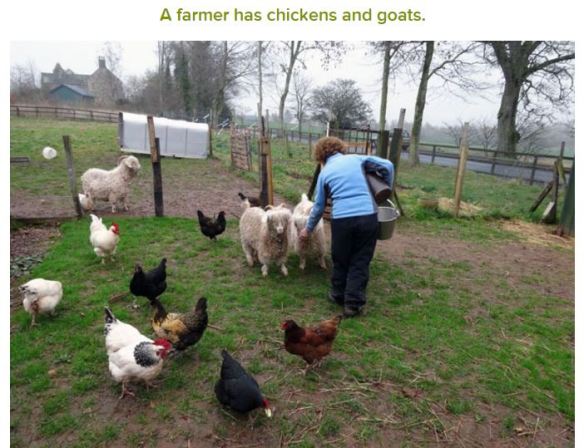
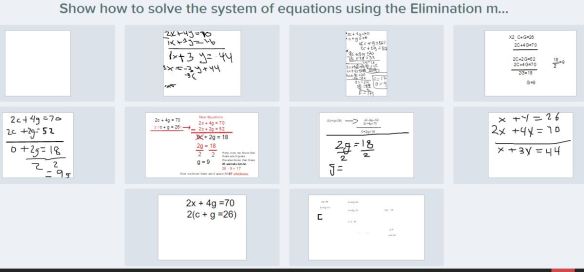
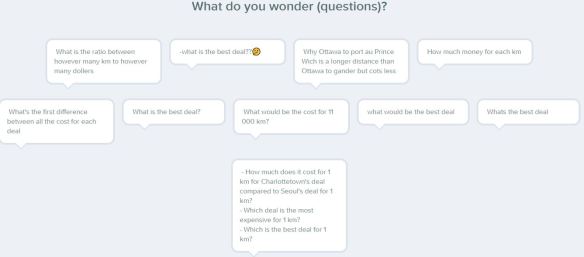
 We discussed some of the above responses that did not meet the criteria of a total of 70 legs and why.


 For my MFM2P group this followed the
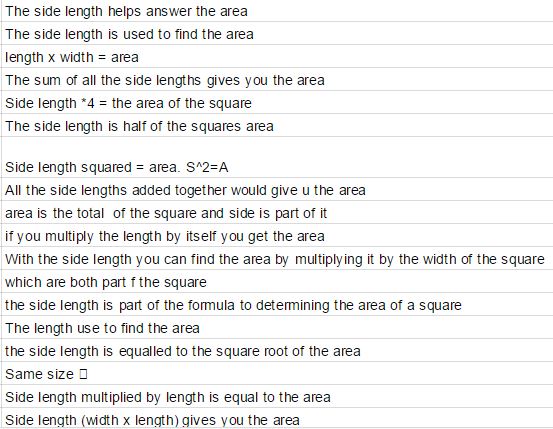

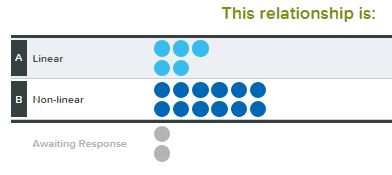
 We then discussed the shape of the graph being a curved line & the first differences being not equal (which only some students had pointed out).
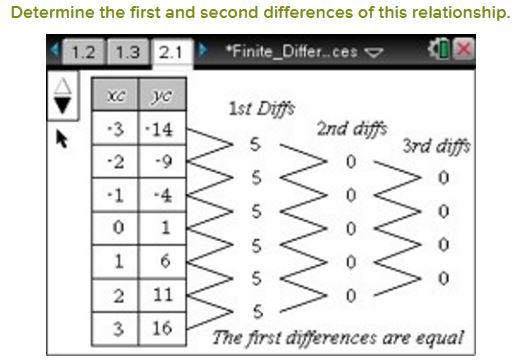

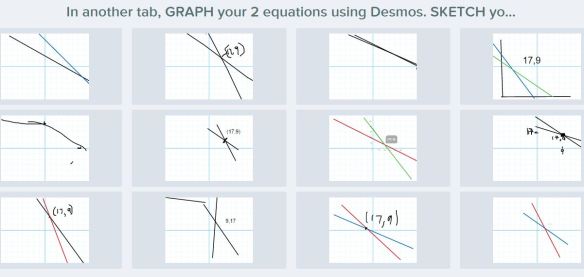
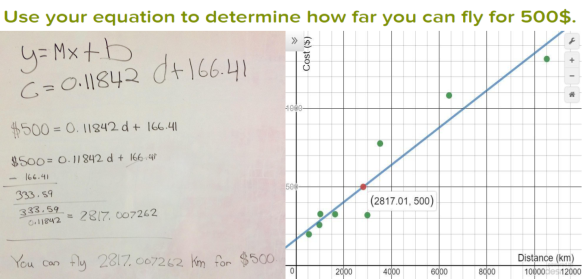
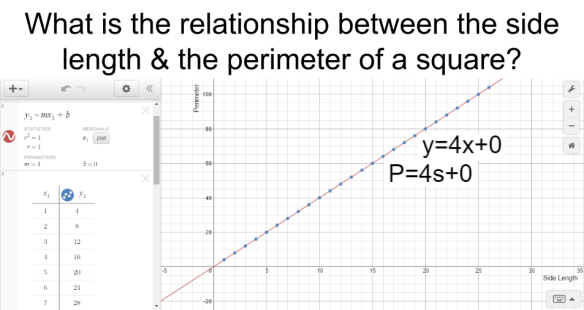
 The 2P students had practiced performing a linear regression with Desmos the day before during the Perimeter investigation. The 2D students had mostly never seen Desmos before. I walked around helping students that got stuck or couldn’t find where they’d mistyped something & gotten an error. The result was:
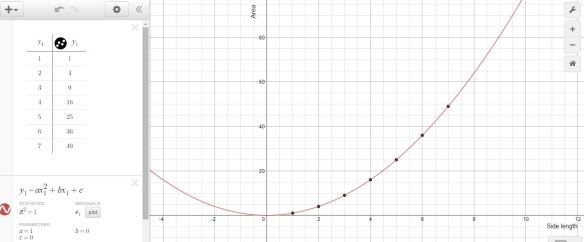 at which point I did some direct teaching about how to use the a, b, and c value determined by Desmos to write out an equation for the relationship between side length and area. I also introduced the word parabola to them while we looked at the graph from Desmos, zooming in & out.
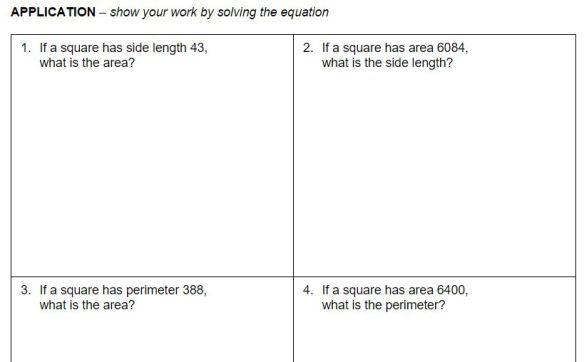 and this became the homework for the MFM2P class as we ran out of time in class.


 Students then completed 4 practice problems on the earlier handout to solve for either perimeter or side length given the other. This all took 2 days and they had time at the end to start the homework which was a Khan Academy exercise set titled “Slope Intuition”.
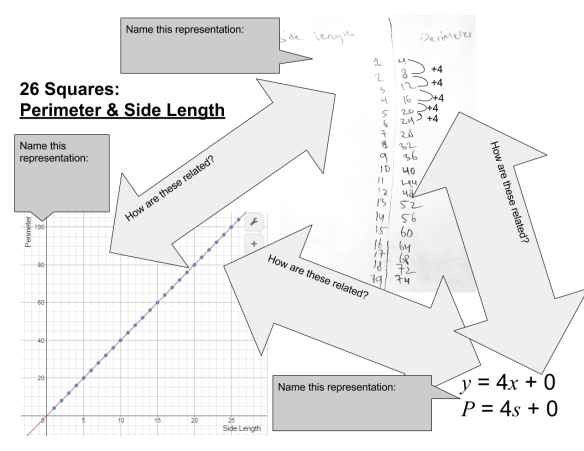 They had to name the 3 different representations & explain how they are all related to each other. After 5 minutes of working on it themselves, I had them get up & walk around the room to read each others’ sheets in a gallery walk type style. Then they returned to their seats & could add, change or erase anything from their own notes. I then led a class discussion about the connections of slope & y-intercept between the 3 different representations.