Course Packs for the #ThinkingClassroom

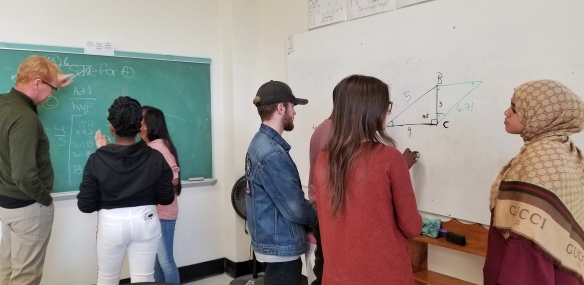
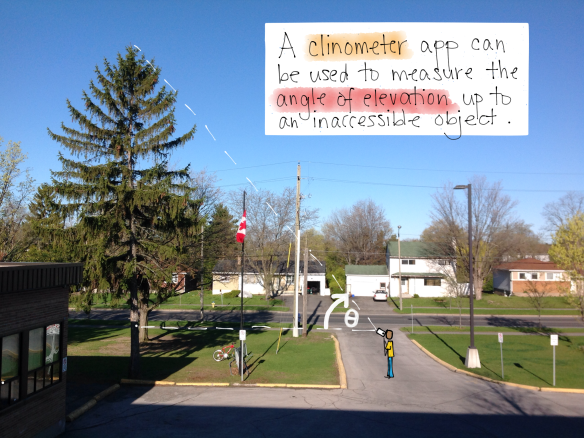
I had the pleasure of welcoming Peter Liljedahl to visit my classroom this past week. Peter is the brains behind the Thinking Classroom framework that I’ve been implementing in my classroom over the last few years. While he was in town this week for the OAME Leadership conference he took the time to visit some Thinking Classrooms in the area and I was lucky enough to have him come visit ours. He spent a period with my grade 10 applied students where I was running a problem-based learning task (or 3 Act Math task) to do with solving for the missing angle in a right triangle.

20171108_143421-01.jpeg

Peter Liljedahl & Judy Larsen visit

The two most popular elements that most people know about Peter’s Thinking Classroom framework are vertical non-permanent surfaces and visibly random groups. Another of the elements is to have students take meaningful notes after the problem-solving task; giving them time to select, organize & synthesize the ideas they want to keep in their notes. My way of doing this has been to create course packs for each of the courses I teach. Peter shared out this idea during his keynote on Friday and a number of teachers were interested in hearing more about them and seeing examples, so I figure a blog post was in order!

What are my course packs?
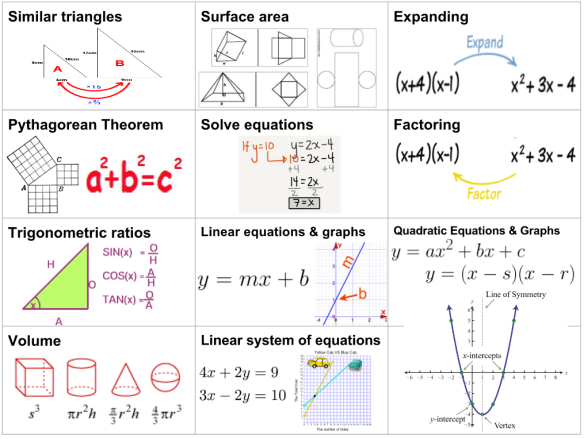
They are approximately 10 pages long (1 page per overall expectation for the course) or 5 sheets back to back. There is a box for each of the key terms or skills they need to know (I pull these from the specific expectations listed in the curriculum docs). For my applied classes I usually fill it in with worked examples of the skills, but leave the key terms blank for them to complete (see below right). For my academic classes I usually leave every box blank for students to complete (see below left). I copy & staple one for each student and hand it out at the beginning of the course.

How do we use them?
A place for meaningful notes: After each activity we do, I get my students to take out their course pack & open to whichever page matches the content we covered that day. I give them time to write their own notes based on the student work on the boards, the short notes I may have written on a board or on their boards, and I’ve also suggested mathisfun.com as a good site for definitions at their level. I also encourage them to put both images & words in every box.
A reference document: When groups go up to their boards to solve the day’s problem, one of the 3 members is given the role of bringing the course pack (the other 2 are responsible for scribing and calculating, respectively). Groups will often look through the worked examples if they need some help solving the day’s problem or remembering how to do something. On individual practice days, students often have their course pack out to help them with their practice problems. When students are stuck on a problem, I’ll often ask them to show me where a similar problem is in their course pack & we’ll use that as our starting point as we work together.

Can I see some examples?
Sure can!
Grade 10 applied course pack
Destreamed grade 9 (applied & academic together) course pack:
Grade 10 academic course notes

Still have some questions? Hit me up in the comments below or on Twitter! Have you made some of your own? Share links to your course packs below too!

– Laura Wheeler (Teacher @ Ridgemont High School, OCDSB; Ottawa, ON)

Tree Height #3ActMath #MPM2D #MFM2P

Here is a tree height 3 act math activity I do for right angled trigonometry with both my 2D & 2P classes. The screenshots below were taken from my 2P class this semester.

Act 1: Setup

IMG_1636

Some noticings:IMG_2298

Some wonderings:IMG_2299

We do some turn & talk guesses for “too low” & “too high” then we go back to Pear Deck for our best estimate:IMG_2300

Act 2: Measure & Solve

Students downloaded a clinometer app onto one of the phones in their group.

Here are photos of last year’s group out measuring:

Up to the “vertical non-permanent surfaces” to solve in their “visibly random groups”:

This slideshow requires JavaScript.

Act 3: Consolidation

This is one activity I don’t have a true act 3 for – I don’t know the actual height of this tree 😦 I led a class discussion going over the solutions from various groups. We discussed the fact that trig would not find the whole tree height & that groups needed to add the height of the person up to eye level to their value found using trig. I sent groups back to their boards to adjust their solution for this (final photos above).

The whole activity, including the Pear Deck file, can be found here.

– Laura Wheeler (Teacher @ Ridgemont High School, OCDSB; Ottawa, ON)

#3ActMath – What is it?

I learned about a great tool this past weekend at the Ontario Summit; Adobe Spark video. A huge shoutout to Rushton Hurley for the introduction to this tool. It’s a super fast & easy way to combine photos, videos & text and narrate over top of it to create a seamless professional looking video.

I tried my hand and created one about the 3 Act Math lesson style made popular by Dan Meyer. Give it a watch & let me know what you think:

Update 2018.01.12: I made a sketchnote about 3 Act Math & listed some sites to explore the topic further & you can find it all here.

– Laura Wheeler (Teacher @ Ridgemont High School, OCDSB; Ottawa, ON)

Kahoot: game-based learning

Kahoot.PNG

Kahoot is a game-based learning system for the classroom. My students love playing Kahoot; it’s a great way to practice & review material.

There are 4 types of Kahoot games:

  1. Quiz – multiple choice questions
  2. Jumble – choose the correct order of the 4 answers
  3. Survey – a quiz with no right or wrong answers, no scoring, no leaderboard
  4. Discussion – a single-question survey

How it works: The teacher presents the questions on the projector. Students (using their own device or grouped to 1 device) choose their answer. Points are assigned for correct answers, with more points for quicker responses. After each question, a graph is displayed with the results of the class, showing how many responses were chosen for each answer choice. Before the next question, a leaderboard of the top 5 scorers is displayed to the group.

Why Kahoot is awesome:

  • Increases student voice, engagement, & accountability.
  • Students get immediate feedback as to whether or not they got the answer correct.
  • Spurs class discussions; teacher facilitates discussions when results show many students are struggling with a certain question or topic.
  • Try playing in Ghost Mode where students play against their previous attempts, trying to beat their previous score.
  • There’s a bank of quizzes created by teachers to choose from, you can create your own from scratch or even duplicate then edit someone else’s.

My favourite way to play is to put the game on “randomize order of questions” and play the first 10 random questions from a large bank of questions I’ve created for my entire course as a warm-up to start class.

Here are my Kahoot question banks for MPM2D and MFM2P.

[update: Here’s a newer post about how we use Kahoot in our class; my pedagogy of Kahoot]

– Laura Wheeler (Teacher @ Ridgemont High School, OCDSB; Ottawa, ON)

T-Shirt Fundraiser problem #MPM2D

Another quick post to catch up on a problem-based lesson from the other week. This one was co-planned & co-taught with my student teacher, Nicole Darling.Summary (8)


We made up a problem to do with selling t-shirts, comparing costs & number of shirts in order to teach the elimination method of solving linear systems.

We posed the problem:

Your class is trying to raise money through selling t-shirts. There is a $150.00 set-up charge and each t-shirt costs $4.00 to make. You will be able to sell your t-shirts for $10.00.

What questions can we ask? Sample responses:

Capture

Estimate how many shirts you would need to sell in order to break even:Capture

Solve: A few (but not all) of their boards:

Most groups solved using a table or just by calculating the 150$ debt divided by the 6$ profit on each shirt to find 25 t-shirts. One group actually did substitution all on their own. Ms. Darling then did some direct teaching on the substitution method w/ the class as a whole & sent them back to their boards to check their answer using this method.

Interactive Pear Deck slide deck available here.

– Laura Wheeler (Teacher @ Ridgemont High School, OCDSB; Ottawa, ON)

Piggy Bank problem #MPM2D

Summary (7)I’m trying to blog more about my lessons/activities/problems this year. Today’s is more of a problem-based learning approach I guess. My goal was to review solving systems graphically with my grade 10 academic students.

I made up a problem about Lisa & Bart saving money in their piggy banks:

Lisa puts $3 in her piggy bank each week. She has a total of $19 in it as of today.
Bart puts $1 in his piggy bank each week. He has a total of $9 in it as of today.

What questions could we ask & solve? Some sample responses:

Capture.JPG

When do they have the same amount of money in their piggy banks?

Estimate:
Capture

Solve:

Everybody used a table. I forgot to take photos of each board, but most groups answered that they will never have the same amount of money. Two groups worked their tables backwards to include negative numbers of weeks (before today). I then asked them to write an equation for Bart & Lisa each which we then graphed using a Pear Deck drawing slide.
Here’s a summary of our work:Summary (7)

Pear Deck interactive slide deck available here.

– Laura Wheeler (Teacher @ Ridgemont High School, OCDSB; Ottawa, ON)

26 Squares – Area #MPM2D #MFM2P

CaptureFor my MFM2P group this followed the Perimeter activity I did with the 26 Squares manipulatives (partially pictured at right). For my MPM2D group, this was their first introduction to working with the 26 squares manipulatives. For both groups this was their first introduction to Quadratic relations and parabolas.


Predict: What is the relationship between side length and area of a square?

Capture.JPG

Create a table of values:

This was done in their groups at their boards.
ToV
I had to encourage groups to count the grid on their squares. Many were calculating the side length times 4, while others were trying to square the side length but doubling instead. For each of those groups, I redirected them to our physical squares cut out w/ grids [pictured at top of post] & asked them to count the area of a 2×2 square, then a 3×3 square, and so on.

Graph: Back in their seats students were given this handout & asked to graph by hand the data from their table.

Linear VS Quadratic: Students were asked to choose which type of relation they thought this was.
Capture
And why:Capture.JPG
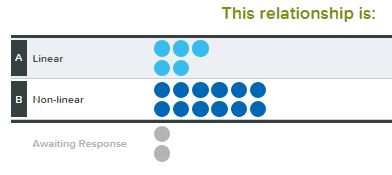
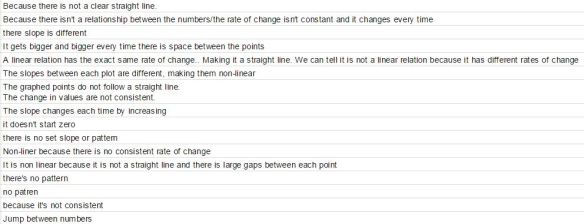
We then discussed the shape of the graph being a curved line & the first differences being not equal (which only some students had pointed out).

First & second differences: Groups were sent back to their boards & their table of values with this prompt:
Capture
IMG_1123
We discussed that second differences being equal means this is a Quadratic relation; a new key term for us. The black writing on the whiteboard above is my own addition during the class discussion.

Desmos & Quadratic regression: Back at their seats, individually students used Desmos to perform a quadratic regression on their table of values. They had this prompt on their handout from earlier:Capture.JPG
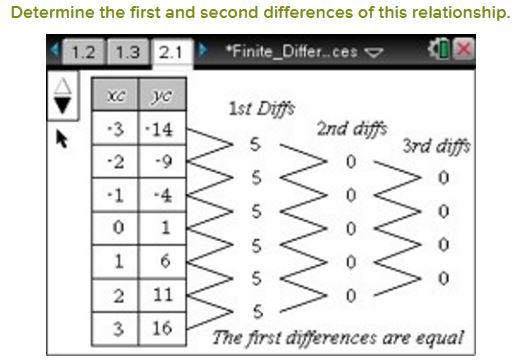
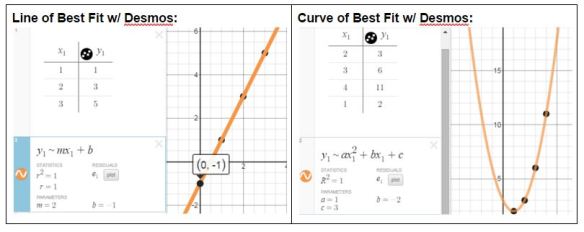
The 2P students had practiced performing a linear regression with Desmos the day before during the Perimeter investigation. The 2D students had mostly never seen Desmos before. I walked around helping students that got stuck or couldn’t find where they’d mistyped something & gotten an error. The result was:Capture.JPG
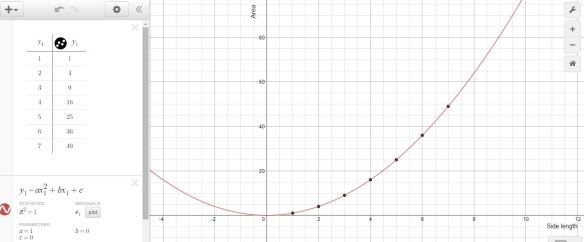
at which point I did some direct teaching about how to use the a, b, and c value determined by Desmos to write out an equation for the relationship between side length and area. I also introduced the word parabola to them while we looked at the graph from Desmos, zooming in & out.

In their groups at their desks they had 4 application questions to work on:Capture
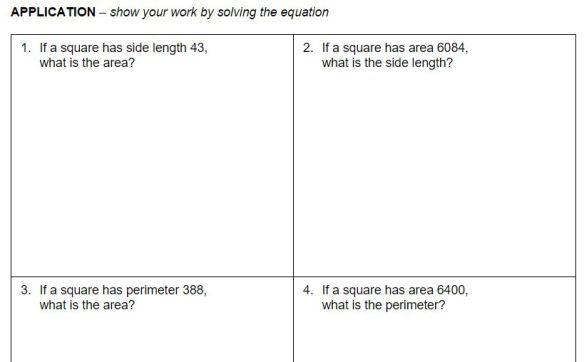
and this became the homework for the MFM2P class as we ran out of time in class.

Key features of a quadratic graph:

With the 2D students I had time left to do some direct teaching about y-intercept, x-intercept / zeros, vertex, max/min, & axis of symmetry. Their homework was on Khan Academy to identify these key features given an equation that they could graph using Desmos.
For my 2P students this lesson came a few days later with class time to work on the Khan Academy exercise set.

My reflection: I wish I had asked at the end of the activity for students to restate in words the relationship between side length & area.

Folder w/ handout & Pear Deck interactive slideshow here.

– Laura Wheeler (Teacher @ Ridgemont High School, OCDSB; Ottawa, ON)

VNPSs to the rescue!

This month I have a student teacher teaching my two grade 10 classes each morning. He’s been doing a great job trying out the spiralled curriculum & activity-based teaching approach that I use. He’s also continued using the visibly random groups (VRGs) & vertical non-permanent surfaces (VNPSs) that I have set up in my classes. Today we had a moment that really cemented for us why the VNPSs are so powerful:

A bit of background first. This year I’m teaching the primary trig ratios using trig trainers & a trig table. The trig trainer provides the sine & cosine values for a right triangle with a hypotenuse of 1. Students then use similar triangles to solve for missing information like this:

Screenshot 2015-04-15 at 10.50.27 AM

So far we had covered how to find missing sides, but not yet how to find missing angles using this method. The students had all the knowledge they needed to do so, there was nothing new to teach them besides how to apply their knowledge in a way to find a missing angle.

So yesterday my student teacher started his lesson by putting this problem on the board:Screenshot 2015-04-15 at 10.46.12 AM

He asked the class questions about how they used the trig trainer to solve for missing sides (activating prior knowledge) to elicit ideas about similar triangles and scale factors. He then asked them how they might use the same ideas in order to solve this problem.

Crickets.

Nothing.

No answer.

There were a few awkward minutes while he waited for them to figure out how to apply their prior knowledge to this new example type. He tried rephrasing his question but they weren’t giving him anything. They weren’t willing to venture a guess out loud. He was hoping they would suggest to him the method to solve for the missing angle & he would solve it on the board for them (direct teaching).

But I suspected that if asked them to, most of the students could solve the problem based on what they’ve learned so far, even if they couldn’t verbalize how to do so (or weren’t willing to verbalize it). So from the back of the room I piped up & suggested sending the groups to their assigned vertical surface (each group has a blackboard or whiteboard space assigned to them). My student teacher obliged & sent them to their boards.

Within one or two minutes a couple of the groups were solving the problem – using the exact method that my student teacher hoped they would explain to him in the earlier discussion. The groups that didn’t figure it out right away looked at the boards of those groups that had & quickly caught on to the idea and started solving themselves also. Here is the solution from one group:IMG_8438

Once most groups had solved it, my student teacher asked them to return to their desks & consolidated their learning with the whole group and then assigned some practice problems.

This experience really drove it home how beneficial the vertical surfaces are. When asked to explain orally how to solve the problem, students were not able. But working on the problem at their boards, most groups solved without having to be taught how to do this specific type of problem. And those that didn’t get to the final answer were still able to see the full solution presented, and done so in multiple ways by different group.

So powerful!

What’s on My Classroom Walls

I think the state of a classroom can say a lot about a teacher. And what’s on the walls of the classroom can give us insight into what the teacher finds important enough to emphasize. When I was teaching grade 3/4/5 math to ELD students last year I had a lot of hand-written chart paper on the walls with drawings, keywords, and examples that we would write out together as a group. I’ve heard it said many times that anchor charts are more effective if co-constructed with your class.

This year, the posters on my walls are less about specific topics from our courses, and more about general frameworks for our courses. Let’s have a look at what I’ve posted:

The Mathematical Processes:
IMG_8065
I want to focus more on the Mathematical Processes this year; especially when we’re consolidating our group work on vertical non-permanent surfaces for our various activities. It’s something that Bruce McLaurin & Al Overwijk inspired me to think more about as they talked at EdCamp about playing with ways to assess & evaluate students using the 7 processes. So I put these posters up for my students benefit but also as a reminder to me to incorporate these into our consolidation/debrief discussions.
My Mathematical Processes posters here.

MPM2D Overall Expectations:
IMG_8066
This wall shows the overall expectations for the MPM2D course; Grade 10 Academic Math. My MPM2D posters here.

“For Grades 1 to 12, all curriculum expectations must be accounted for in instruction and assessment, but evaluation focuses on students’ achievement of the overall expectations.”                  –Growing Success

This wall also has some key ASL phrases as I have a deaf student in one of my classes this semester and I am hoping that these posters will help the hearing students communicate with my deaf student without always having to go through the interpreter.
My ASL key phrases posters here.

MFM2P Overall Expectations, Testing Keywords & ASL numbers:
IMG_8067
This wall has my MFM2P overall expectations for grade 10 applied math, available here.
It also has a list of keywords used on the board-wide exam and the grade 9 EQAO that I’ve compiled over the years. That set is available here.

ASL finger-spelling alphabet:
IMG_8068
This wall has the ASL finger-spelling alphabet. The ASL alphabet & numbers posters are available here.

So, what’s on your classroom walls and what does that say about you as a teacher? Does the look of your classroom reflect the way that you teach? Share with us!

– Laura Wheeler (Teacher @ Ridgemont High School, OCDSB; Ottawa, ON)