Pear Deck is an interactive slidedeck tool that gives students the ability to respond to teacher prompts using their personal devices. I quickly approached the presenter, who is also the COO & Co-Founder of Pear Deck – Anthony, about offering to present at conferences in the area on their behalf in trade for a complimentary premium account. Now Pear Deck is an incredibly useful & powerful tool for student voice even when using the free account! But I thought why not ask & see if I can get the full hog premium features? Since that time, Pear Deck has created their Certified Coaches program which I’ve been a part of since the beginning and I’ve made such good use of Pear Deck in all of the subject areas that I teach. I am passionate about sharing this tool with other teachers!
So this week’s edition of Learning in the Loo is all about Pear Deck. It includes a sketchnote covering what Pear Deck is all about, a few of the differences between a free & a paid account (to show that the free one is still awesome!) and a quick how-to-start guide for the Pear Deck add-on in Google Slides:
Interested in posting Learning in the Loo posters in your school’s staff washrooms? My entire archive can be found here.
– Laura Wheeler (Teacher @ Ridgemont High School, OCDSB; Ottawa, ON)
A month ago or so I read a post by Mr. Hogg about his Fast Walker activity. I thought it would be a great way to introduce linear systems graphically to my combined grade 9 math class before the end of the semester. I also did this activity with my Grade 10 applied students – next semester I’ll use it as an introduction to systems graphically with them earlier in the course.
What turned out to be super awesome is that a student in my grade 9 class just won gold at OFSAA last week! So I tweaked Mr. Hogg’s activity to use Joe’s winning data in our problem. I also structured the activity to be a 3 act math task. Here’s what we did:
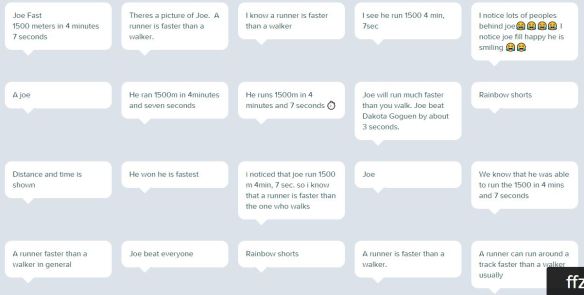
Act 1: Notice – Wonder – Estimate
What do you know / notice?
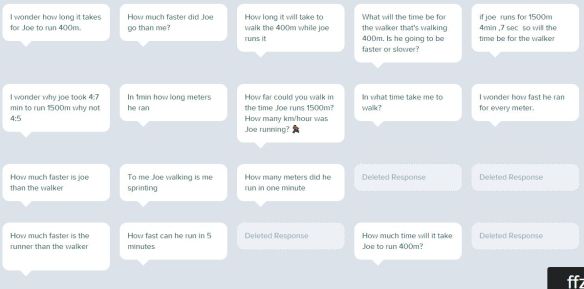
What do you wonder?
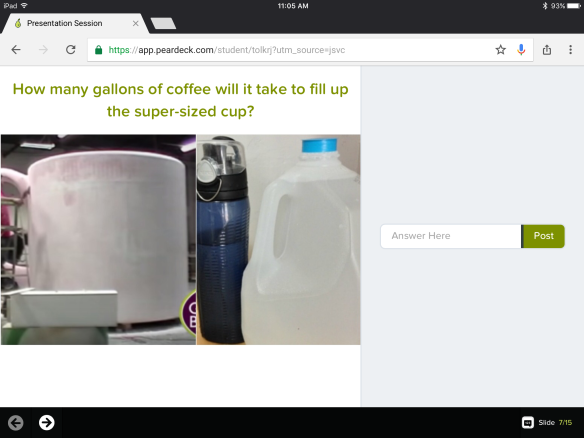
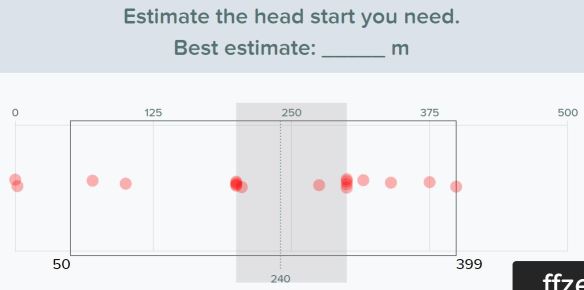
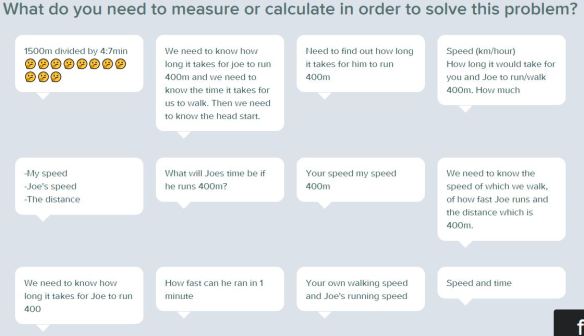
If you want to cross the finish line at the same time as Joe, what distance head start will you need?
Act 2: Measure & Solve
Students were told they had to stay in class when taking measurements; my idea being to force them to time themselves walking over shorter distances (the length of our classroom) and then use that to model their speed for this problem given. Each student had to calculate their own head start:
This slideshow requires JavaScript.
Act 3: Check & Reflect
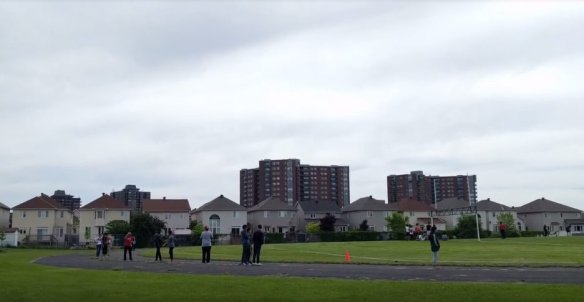
We went out to our 400m track and students measured out their starting position. They staggered themselves according to their calculation (photo below – tried to take video but my phone battery died). Most students were around 100m before the finish line (~300m head start). We counted down & Joe started running & the class started walking. I so wish I’d gotten the video because it was awesome how close they all finished to each other!
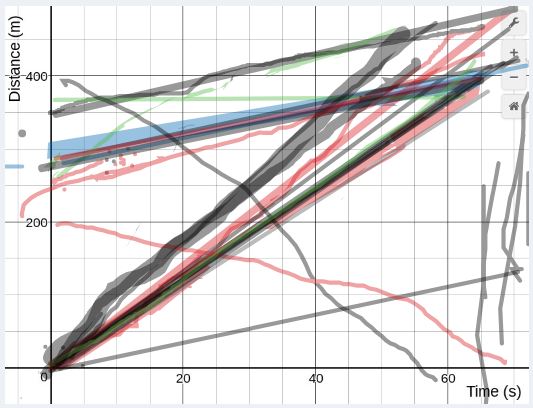
I had my grade 9s graph their walk & Joe’s run on the same grid. Here are their graphs overlaid on top of each other:
Most students had the right idea, and I talked to a few with incorrect graphs individually but when I look at this overlay now I can see that I missed helping a few students correct their work 😦
We discussed which line was partial variation & which one was direct. I then introduced the language of “linear system” and “point of intersection”. My 2P class time to create an equation for each line also.
The next time I try this, I’d like to add an individual follow up question such as if you only had a 50m head start, at what distance would you & Joe meet? At what time would that be?
Here are my files for this activity (the unassociated one is the Pear Deck slideshow).
Tech Tip: Did you know you can add the same Google Doc/file to multiple folders without copying it? I didn’t until recently. It was useful for this lesson because I wanted to have it in the folder for each of the 2 classes I did the lesson with! Once you’ve clicked on the file just press Shift+Z :
– Laura Wheeler (Teacher @ Ridgemont High School, OCDSB; Ottawa, ON)
Here is a tree height 3 act math activity I do for right angled trigonometry with both my 2D & 2P classes. The screenshots below were taken from my 2P class this semester.
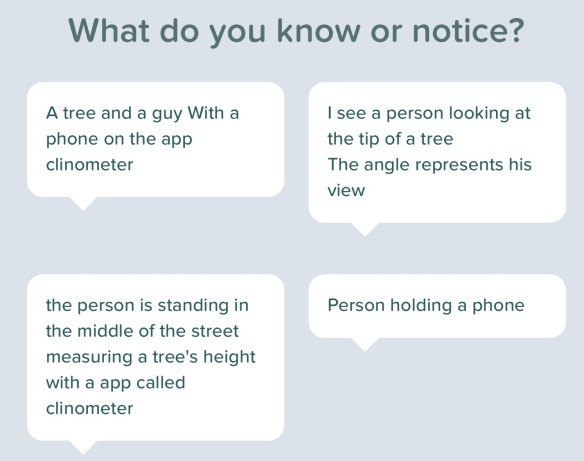
Act 1: Setup
Some noticings:
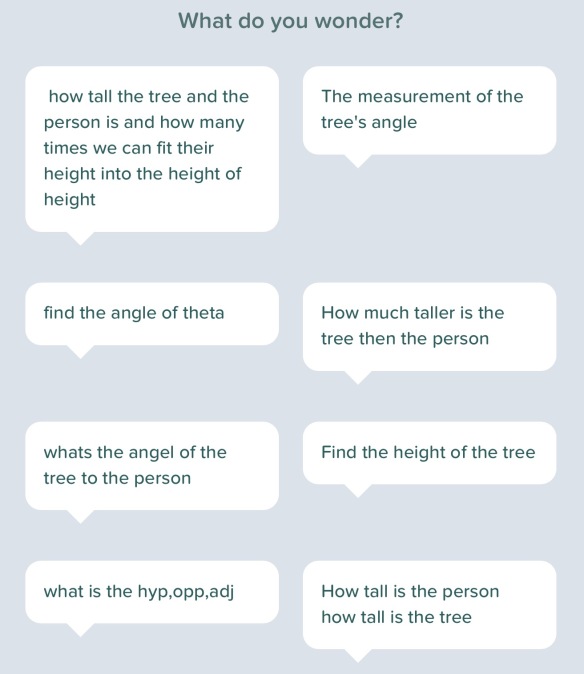
Some wonderings:
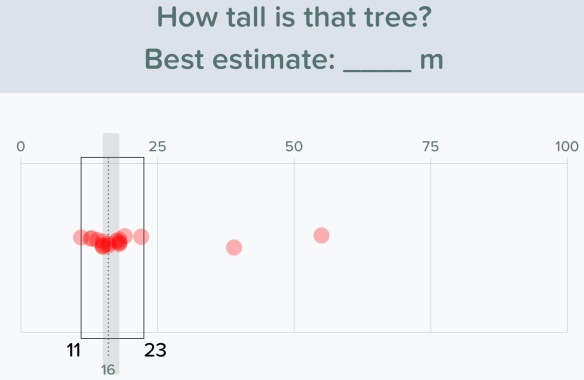
We do some turn & talk guesses for “too low” & “too high” then we go back to Pear Deck for our best estimate:
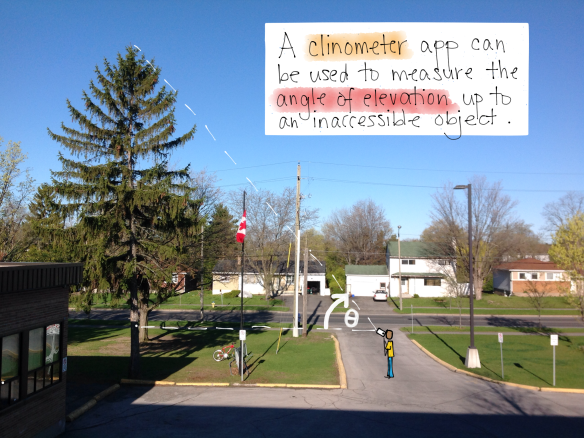
Act 2: Measure & Solve
Students downloaded a clinometer app onto one of the phones in their group.
Here are photos of last year’s group out measuring:
This is one activity I don’t have a true act 3 for – I don’t know the actual height of this tree 😦 I led a class discussion going over the solutions from various groups. We discussed the fact that trig would not find the whole tree height & that groups needed to add the height of the person up to eye level to their value found using trig. I sent groups back to their boards to adjust their solution for this (final photos above).
The whole activity, including the Pear Deck file, can be found here.
– Laura Wheeler (Teacher @ Ridgemont High School, OCDSB; Ottawa, ON)
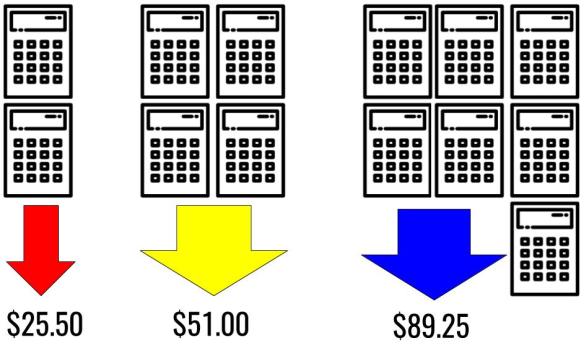
As an introduction to linear direct variation, I put together a quick problem-based learning task that was proportional for my combined academic & applied class:
Scenario:
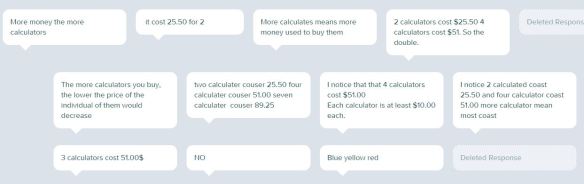
What do you notice?
I had to use the Pear Deck dashboard to hide some responses that involved calculating the price per calculator as this was part of solving the later problem. I suppose I could have left them up, but I wanted to leave the calculating part until later when students were in their groups.
What do you wonder?
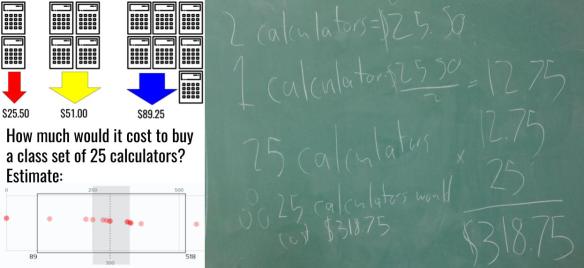
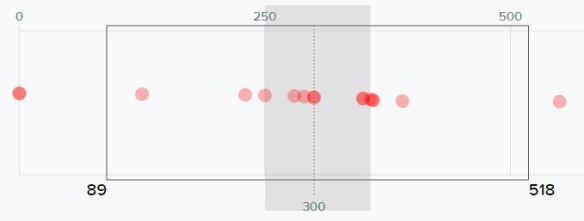
How much would it cost to buy a class set of 25 calculators?
Best estimate: ________$
Solve:
You can find the Pear Deck slideshow in this folder. Also in the folder is a follow up slideshow exploring the concept of Direct Variation.
– Laura Wheeler (Teacher @ Ridgemont High School, OCDSB; Ottawa, ON)
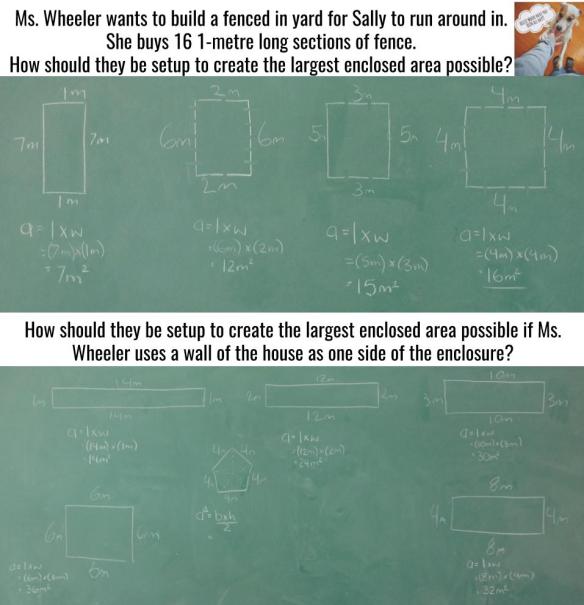
I took the typical “find the largest area given a specific perimeter” problem and created a hands-on, problem-based learning task for my combined grade 9 Math class (academic & applied combined):
Scenario:
Ms. Wheeler wants to build a fenced in yard for Sally to run around in.
She buys 16 1-metre long sections of fence.
What do you wonder?
Physical & Visual Representations:
The yard must be fully enclosed. Use toothpicks to create show different ways of placing the 16 pieces of fencing (I forgot to take photos of this part but they made stuff like this):
Draw your shape & label its dimensions:
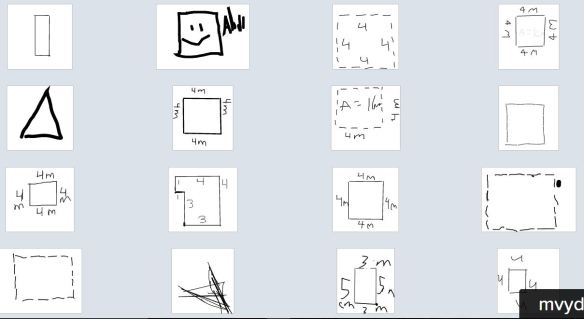
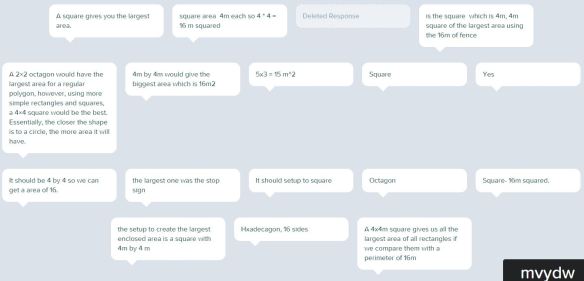
How should the pieces be set up to create the largest enclosed area possible?
What shape offers the largest area?
We discussed that while a square was the largest rectangle possible, there were other shapes possible with greater areas.
How should the pieces be set up to create the largest enclosed area possible if Ms. Wheeler uses a wall of the house as one side of the enclosure?
We have some more exploration to do here. I left this pretty open and they explored various shapes. But I’m not sure they’ve drawn any solid conclusions just yet for the case where we have 1 side of the shape already accounted for.
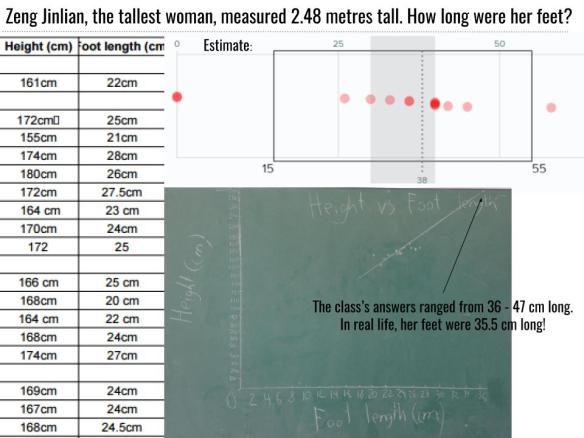
As an introduction to Linear Relations with my combined 1D/1P grade 9 Math class we investigated height VS foot length and the guinness record holder for the tallest woman:
I asked students to measure their height and foot length and record it on a Google Spreadsheet we had up on the projector:
What do you notice?
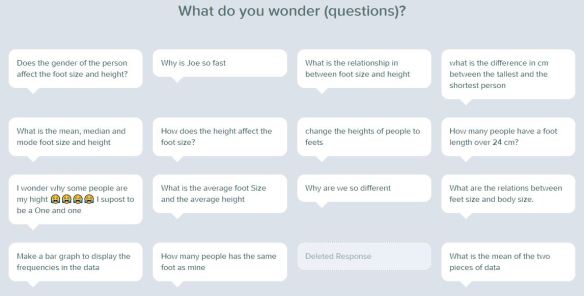
What do you wonder?
I posed this question:
Zeng Jinlian was born in 1964 in Yujiang village in the Bright Moon Commune, Hunan Province, China. She holds the record as the tallest woman. She measured 2.48 m (8 ft 1.75 in) when she died on 13 February 1982. How long were her feet?
Estimate: _____ cm
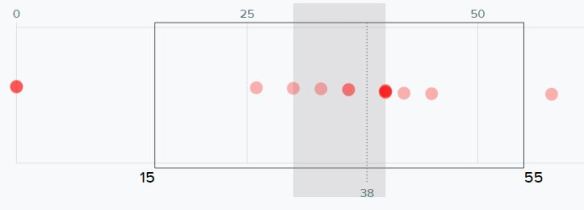
Students were sent in their VRG groups to their VNPS boards to solve. Here are their boards:
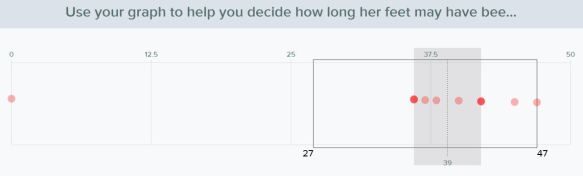
Since it is still early in the semester I scaffolded the activity a bit by instructing them to create a scatter plot of the data on their board to help them solve the problem. I did not however instruct them to use a line of best fit, although many groups used that strategy to help them come up with an answer. Some groups had graphs with a Height axis that went high enough to lookup Zeng’s height and find the corresponding foot length from the line of best fit. Other groups made an educated guess based on the trend the points were showing.
Each student was asked to determine her foot length based on their graph:
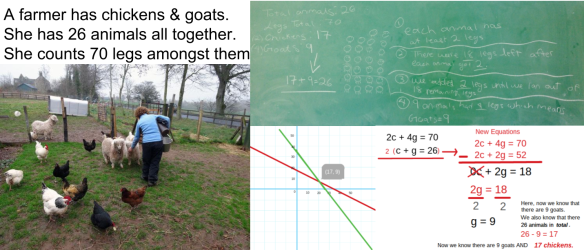
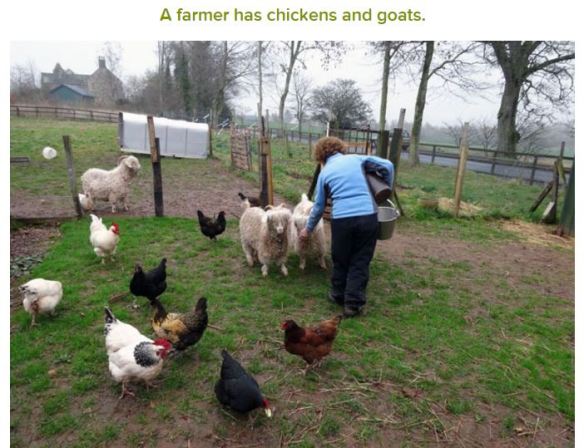
I asked some questions on Pear Deck to get students thinking about the parameters of the problem:
We discussed some of the above responses that did not meet the criteria of a total of 70 legs and why.
Students went to their boards in their small groups to solve this problem:
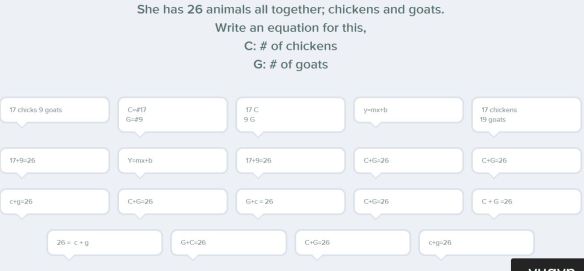
She has 26 animals all together. There are 70 chicken & goat legs all together. How many chickens? Goats?
Most groups were very unsure as to how to proceed in their solving. Most were simply guessing & checking various pairs of numbers. After a few minutes of allowing that productive struggle, when I noticed frustration setting in for some, I asked if anyone had considered drawing animal bodies & assigning legs to them? Here are the student boards:
This group’s work is a combination of the divying up legs strategy & them finding the answer on other groups’ boards.
This group never got to the answer. They were drawing 26 of each with plans to take & give some legs from one group to the other.
Was floored by the amazing explanations by this group!!!
We returned to our seats and our Pear Deck session & I put it into student-paced mode. I asked them to create the equations for the various parameters of the problem:
They struggled with this so I did some direct teaching about how to build the equation for this and the next slide:
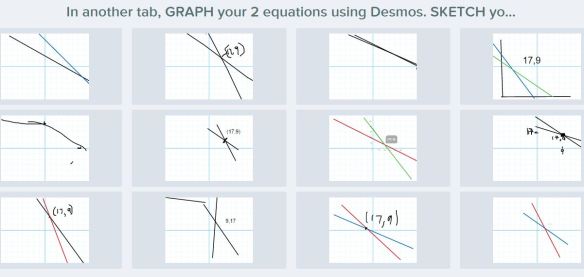
Students were asked to use Desmos to graph their 2 equations & then sketch the graph and point of intersection:
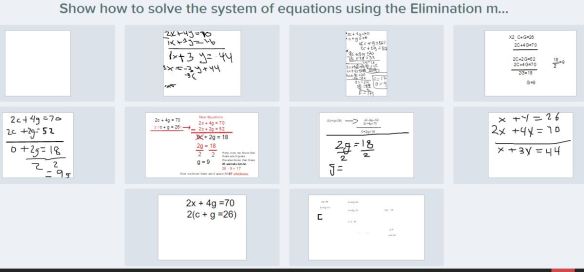
Students were asked to develop an algebraic solution using the elimination method:
Not all of my students are comfortable with the algebra still (even though we’re at semester’s end now).
I like that we used 3 different methods of solving this problem; diagramming, graphing & algebraic. I want my 2P students to know they can always fall back on “less sophisticated” methods to solve these problems at evaluation time (as opposed to the algebraic solution).
The resources can be found here (including the Pear Deck interactive slideshow).
– Laura Wheeler (Teacher @ Ridgemont High School, OCDSB; Ottawa, ON)
This summer Pear Deck announced the introduction of student-paced mode; the ability for the teacher to allow students to work through the slide deck at their own pace. This is a feature I enjoyed in the Desmos activities I’d been building for graphing (interesting also that Desmos introduced their teacher-paced mode around the same time that Pear Deck introduced student-paced; both platforms now offering both pacing options).
Not sure what Pear Deck is or does? Watch this quick video before reading further:
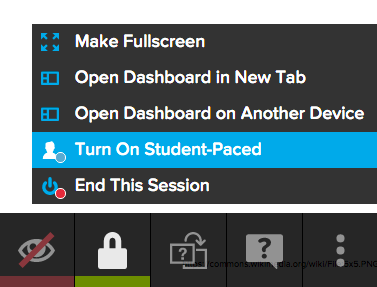
How to turn on student-paced mode:
Click the 3-dot menu icon on the bottom right of your screen while presenting your Pear Deck, and the option to turn student-paced mode on (or off later) will be there:
Act 1 consists of present my students with a scenario via photo or video & asking them
What do you notice?
What do you wonder?
Then I show them the problem I’ve chosen for the day (usually it’s one that most kids write down for “what do you wonder?” since I’ve carefully selected the scenario to lend itself to asking the question I want based on our learning goal).
Estimate the answer: too high, too low, best guess?
Act 1 happens via Pear Deck in TEACHER-paced mode. Students are at their seats in their visibly random groups for the day assigned by playing cards. They use their own phone or a loaned chromebook (I have 6 that live in my classroom) to answer these questions on Pear Deck. We often have a quick class discussion here too about reasonable estimates and their strategies for that. I, as the teacher, am choosing when to move the slides forward for the entire group.
Act 2 consists of sending each group to their assigned vertical non-permanent surface (ie. chalkboard or whiteboard) to solve the problem. Often groups also need to do some data collection or measurement here in order to solve the problem.
At this point I have a slide with the original picture & the problem to solve written on it projected on the board while the groups are solving. The moment the first group to finish solving heads back to their seats, this is when I turn on STUDENT-paced mode. The rest of the slides will be follow up questions to reflect on their solution or to apply their thinking to extension problems. Students work on these at their own pace at their own desk.
When all groups are done and back at their seats, I lead a class discussion about the solutions from each group using the 5 practices for orchestrating productive mathematics discussions. During or after this discussion, we might also look at some of the responses to specific follow up questions on Pear Deck. If we do, I turn OFF the student-paced mode to bring everybody’s screen back to whichever one we are discussing.
Act 3consists of checking our answer either in real life (as we did for the cup stacking activity) or by showing a video or image answer (as we did for the phone charge activity).
Normally, in Pear Deck, there is a projected screen being shown on the board to the whole class by the teacher. The students see a “response” screen on their own device that is different than the one being projected. When in student-paced mode, the student can see both the content slide AND The student response slide on their own device. On a tablet or laptop the two screens are shown side by side when in student-paced mode:
When using a smaller device such as a phone or iPod, the student will see a blue bar across the bottom of the screen allowing them to toggle back and forth between the “content” & “response” screens:
Have you used student-paced mode in Pear Deck yet? Share in the comments below how you use it with your own students!
– Laura Wheeler (Teacher @ Ridgemont High School, OCDSB; Ottawa, ON)
I attended the EdInnovation summit this past weekend in Ottawa to present on behalf of Pear Deck. This was the first year that this conference was run by a new organization team (in the past it was an EdTech Team event). There were over 1200 teachers from all of the major (& not so major) school boards in the Ottawa area. The conference is bilingual; in fact 3 of the 5 workshops that I attended were in French! Here are my sketchnote summaries of the keynotes & workshops I attended:
Chris Hadfield keynote
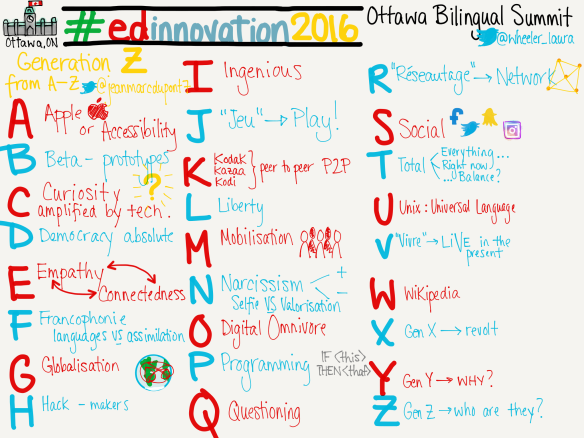
The A-Z of Generation Z by Jean Marc Dupont
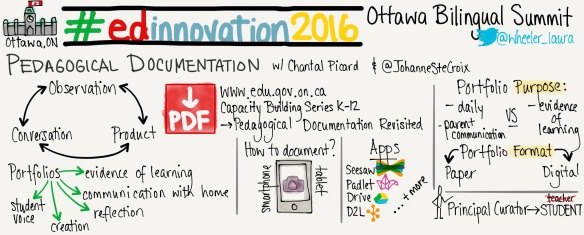
Pedagogical Documentation by Chantal Picard & Johanne Ste-Croix
Leading & Learning & the Modern Administrator by Jim Jamieson
Google Cardboard & Google Street View keynote by John Bailey
GAFE tools to support research & make thinking visible by Jim Jamieson
and last but not least, my own session on Pear Deck:
Keep an eye on this conference if you work in the Ottawa area; it’s a good one!
– Laura Wheeler (Teacher @ Ridgemont High School, OCDSB; Ottawa, ON)
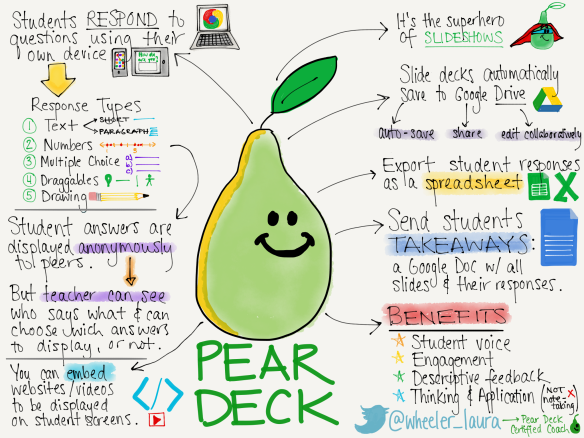
This year I have been working with Pear Deck as part of their certified coach program (similar to the Google Certified Educator). Pear Deck has invited a group of teachers that are heavy users of their product to be trained as coaches. Once trained, the coaches present at various conferences and PD days on behalf of Pear Deck to spread the Pear love. Last weekend while I was at the Montréal GAFEsummit event and took some time to create a sketchnote that summarizes what Pear Deck is, the great features it offers, and the benefits to your classroom. Enjoy!
– Laura Wheeler (Teacher @ Ridgemont High School, OCDSB; Ottawa, ON)


 about offering to present at conferences in the area on their behalf in trade for a complimentary premium account. Now Pear Deck is an incredibly useful & powerful tool for student voice even when using the free account! But I thought why not ask & see if I can get the full hog premium features? Since that time, Pear Deck has created their Certified Coaches program which I’ve been a part of since the beginning and I’ve made such good use of Pear Deck in all of the subject areas that I teach. I am passionate about sharing this tool with other teachers!
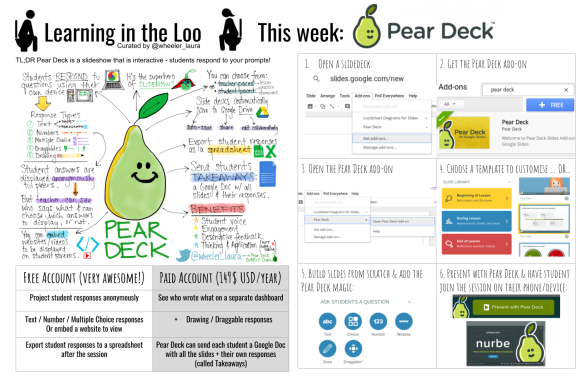


 I had to use the Pear Deck dashboard to hide some responses that involved calculating the price per calculator as this was part of solving the later problem. I suppose I could have left them up, but I wanted to leave the calculating part until later when students were in their groups.
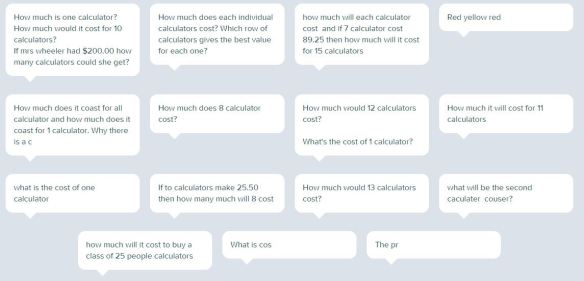


 We discussed some of the above responses that did not meet the criteria of a total of 70 legs and why.