Bank Balance problem

A few weeks ago I was ready to do my first Linear Systems of Equations problem with my MFM2P grade 10 applied class. The first step is to get them to solve systems graphically (a review of gr9 essentially) and interpret the solution. The last few times I did that topic, I used a scenario of a race between a runner and a dog-walker w/ a head start; where/when do they meet? It’s always complicated and requires more hints from me than I’d like. So I decided to design a new scenario – something that would allow us to practice our linear relation skills at the same time. I came up with this scenario of 2 different bank account balances as they grow over time:

Screenshot 2019-03-19 at 2.56.46 PM

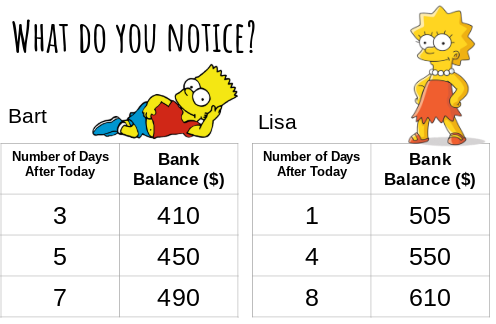
  1. Presented with the above data, we worked through our notice & wonder routine using Pear Deck.
  2. Then I showed them the question I had for them:
    “When will they have the same bank balance on the same day?”
    Students estimated how many days before that would happen via Pear Deck.
  3. Then we had turn & talk time with our visibly randomly grouped (VRG) partners to discuss what we should measure, look up, and/or calculate in order to solve the problem. We shared our thoughts to the whole group.
  4. Then I sent students to their group’s board (VNPS) to solve the problem in any way they saw fit. Periodically when the majority of groups seemed either stuck, or ready for it, I called them all over around some board space to do some direct teaching. The things I called them over to talk about at different moments:
    – first differences & whether or not each table is linear
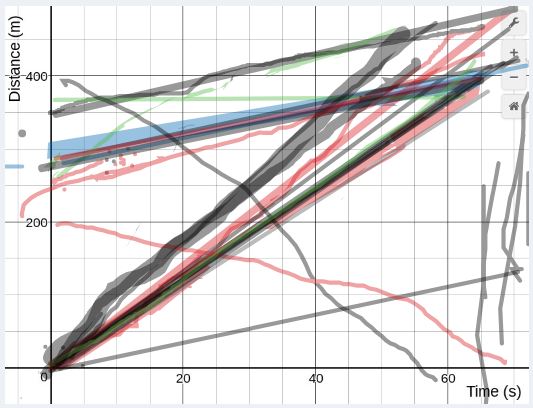
    Desmos: plot the tables
    – Desmos: linear regression for line of best fit
    Asked them to sketch their graph from Desmos on their board.
    Here are their boards:
  5. We had a follow up day where I walked them through interpreting a couple of different graphs of system of equation scenarios.

The whole activity is available in this slidedeck that has added Pear Deck interactivity if you use their add-on.

– Laura Wheeler (Teacher @ Ridgemont High School, OCDSB; Ottawa, ON)

Reflecting on our First Test

My grade 10 applied class this year has some students with some serious gaps in their math abilities/knowledge. We had our first test last week (which is late – about 5 weeks in – too many interruptions to class so far; assemblies, etc). For the first time I tried Howie Hua’s strategy with my class:

I asked my Tweeps if they do VRG for this or let students choose. Almost everyone said they let students choose. I may try VRG next time as there were a couple of students who didn’t get up to talk to anyone. I’ll be asking them for feedback today about how they thought that helped them (or whether or not it did).

Unfortunately on test day due to an assembly running long that morning, they took 10 minutes away from my period. A number of students had trouble finishing. I struggle with that b/c I think many of them want more time, but simply spend the time staring at the page, not being productive in solving. This class is mostly ELLs thought (more than usual) and in the past when that’s been the case & I have slower test takers I have made shorter more frequent tests.

So normally I test ever 2 to 3 weeks once we’ve done activities & practice that cover 4 or 5 of the 9 overall expectations for the course. Then the test is 2 pages double sided, each side of a page is 1 overall expectation (usually one or two problem solving tasks). In the past I’ve changed that to testing every 1 to 1.5 weeks on 2 of the 9 expectations instead. I think that’s what I’ll need to do here so that if a student needs more time they can have it within that class period.

I haven’t yet returned their marked tests (I put feedback only on the test & they receive their grade separately a day later on their evidence record via email; research shows that mark + feedback results in students caring only about the mark, not the feedback). Yesterday I sketched on the board the same triangle based prism they’d had in a Toblerone bar question on the test but with different dimensions. I asked them to find surface area & volume (dimensions were such that they needed to use Pythagorean Theorem to find the height of the triangular base). Most groups took almost the entire period to solve this!!! One group never got beyond the Pythagorean Theorem part. I ran around like a chicken with my head cut off trying to facilitate, correct misconceptions, etc.

As an aside: A colleague came by to watch (said he’s been meaning to for a while now) and I had to ask him not to write on the students’ boards or tell them how to do the next step. Reminded me how hard it is to teach other teachers the skill of not telling students the answers always, but asking questions that help them figure it out for themselves. He said “but they’re nodding so they understand what I’m showing them”. I explained I want them doing the math, not him. I asked him to talk with them but don’t do the math for them.

I also got a short video of the groups getting started on the problem if you’re interested:

– Laura Wheeler (Teacher @ Ridgemont High School, OCDSB; Ottawa, ON)

Course Packs for the #ThinkingClassroom

I had the pleasure of welcoming Peter Liljedahl to visit my classroom this past week. Peter is the brains behind the Thinking Classroom framework that I’ve been implementing in my classroom over the last few years. While he was in town this week for the OAME Leadership conference he took the time to visit some Thinking Classrooms in the area and I was lucky enough to have him come visit ours. He spent a period with my grade 10 applied students where I was running a problem-based learning task (or 3 Act Math task) to do with solving for the missing angle in a right triangle.

20171108_143421-01.jpeg

Peter Liljedahl & Judy Larsen visit

The two most popular elements that most people know about Peter’s Thinking Classroom framework are vertical non-permanent surfaces and visibly random groups. Another of the elements is to have students take meaningful notes after the problem-solving task; giving them time to select, organize & synthesize the ideas they want to keep in their notes. My way of doing this has been to create course packs for each of the courses I teach. Peter shared out this idea during his keynote on Friday and a number of teachers were interested in hearing more about them and seeing examples, so I figure a blog post was in order!

What are my course packs?
They are approximately 10 pages long (1 page per overall expectation for the course) or 5 sheets back to back. There is a box for each of the key terms or skills they need to know (I pull these from the specific expectations listed in the curriculum docs). For my applied classes I usually fill it in with worked examples of the skills, but leave the key terms blank for them to complete (see below right). For my academic classes I usually leave every box blank for students to complete (see below left). I copy & staple one for each student and hand it out at the beginning of the course.

How do we use them?
A place for meaningful notes: After each activity we do, I get my students to take out their course pack & open to whichever page matches the content we covered that day. I give them time to write their own notes based on the student work on the boards, the short notes I may have written on a board or on their boards, and I’ve also suggested mathisfun.com as a good site for definitions at their level. I also encourage them to put both images & words in every box.
A reference document: When groups go up to their boards to solve the day’s problem, one of the 3 members is given the role of bringing the course pack (the other 2 are responsible for scribing and calculating, respectively). Groups will often look through the worked examples if they need some help solving the day’s problem or remembering how to do something. On individual practice days, students often have their course pack out to help them with their practice problems. When students are stuck on a problem, I’ll often ask them to show me where a similar problem is in their course pack & we’ll use that as our starting point as we work together.

Can I see some examples?
Sure can!
Grade 10 applied course pack
Destreamed grade 9 (applied & academic together) course pack:
Grade 10 academic course notes

Still have some questions? Hit me up in the comments below or on Twitter! Have you made some of your own? Share links to your course packs below too!

– Laura Wheeler (Teacher @ Ridgemont High School, OCDSB; Ottawa, ON)

Pumpkin Challenge #3ActMath #MFM2P

It all started with a trip to the grocery store where I noticed a giant pumpkin on display & a prize of $50 in gift certificates if you could guess the weight of the pumpkin:20171012_160744-01

I went back a couple of days later to take some measurements of the giant pumpkin, bought 4 smaller pumpkins of varying sizes & we were on our way!

Day 1

Act 1

What do you know / notice?Screenshot 2017-10-26 at 5.49.51 PM

What do you wonder?Screenshot 2017-10-26 at 5.51.09 PM

Estimate the weight of the pumpkin in pounds:
I passed around a 1lb bag of barley that all the student We start with a guess that’s too high (but not silly like 5000 lbs), then too low (but not silly like 1 lb). Then they make their best estimate:Screenshot 2017-10-26 at 5.53.37 PM.png

Then I have them do a turn & talk with their group (visibly random groups of 3) to discuss what they need to a) measure, b) Google c) calculate in order to solve this problem.

Students made a prediction about which characteristic of the pumpkin the weight would depend on most:Screenshot 2017-10-26 at 6.52.09 PM.png

Act 2: 

I revealed some measurements I’d taken of the giant pumpkin:Dimensions

We had 4 pumpkins of various sizes at stations around the room with a scale to measure weight and rulers & measuring tapes. Groups were sent to their vertical non-permanent surfaces to begin collecting & recording data about any measurements they thought they might need for the pumpkins to help predict the giant’s weight:

Groups recorded measurements and started calculations for volume, etc. in order predict the giant pumpkin’s weight:20171018_143719

At this point we hit the end of the class period. Some groups had some volume calculations but none of them had got to (or really thought of) creating a table or a graph of weight depending on another variable to make a prediction.

Day 2

I was away this day & so students had the period to do some independent practice on Volume & Surface area word problems on Khan Academy.

Day 3

I wanted students to graph weight VS diameter, weight VS surface area, & weight VS volume. So I created a Desmos Activity to walk them through that process:Screenshot 2017-10-27 at 10.57.39 AM.png

I provided students with the raw data they would need (as they had already worked on these types of SA & Volume calculations the previous period – today’s learning goal was all about the linear & quadratic relations between different variables):Screenshot 2017-10-27 at 11.00.16 AM

They found the line of best fit and quadratic curve of best fit. We had a class discussion about which one fit the data better … quadratic!Screenshot 2017-10-27 at 11.03.29 AM

They they used that curve to predict the weight of the giant pumpkin based on diameter:Screenshot 2017-10-27 at 11.05.01 AM

I walked them through that first set of tasks step by step as a whole class making sure everyone understood. Then I turned the Desmos Activity to student-paced mode & let them continue the same graphing tasks for weight VS surface area & then volume (although many of my students gave up working on it once I was no longer leading the class through the activity slide by slide).

Each student had filled out an entry slip for the pumpkin contest at the end of day 1, and I allowed them to adjust their entry if they wanted based on today’s work. I then dropped off all of their entries after school:
Screenshot 2017-10-27 at 11.25.46 AM

Day 4

Started class by revealing the weight of the giant pumpkin.
DRUM ROLL PLEASE . . . 166 pounds!!!

I then presented them with a the 3 models we created, each showing the giant pumpkin’s actual weight as an orange dot & asked which model was the best predictor for the giant pumpkin:Choose a modelScreenshot 2017-10-27 at 11.42.02 AM

I finished by having the students drag dots to any Math from our course that we used over the last few days with this activity:Screenshot 2017-10-27 at 11.44.23 AM

Students had the rest of the period to do some individual practice on “Graphing linear functions word problems” on Khan Academy.

My folder with everything for this activity can be found here. The unassociated files are the Pear Deck interactive slide decks.

– Laura Wheeler (Teacher @ Ridgemont High School, OCDSB; Ottawa, ON)

Banquet Hall problem #MFM2P #PBL

This is my 2nd or 3rd time doing this activity, but hadn’t yet blogged about it. So here goes … I made lots of changes, even from one period to the next.

Prompt:Spartan Banquet Hall.png

Notice-Wonder-Estimate:

Screenshot 2017-10-13 at 3.38.20 PM.png

Screenshot 2017-10-13 at 3.39.27 PM

Screenshot 2017-10-13 at 3.40.35 PM

Solve:
At your boards (whiteboard / chalkboard) in groups of 2-3 randomly assigned (VNPS & VRG).

Most groups started calculating the cost per person for each teacher. I stressed to them multiple times that all 3 teachers were paying along the same formula or “price plan”. They really struggled with how that could be. In first period there was 1 group whose board had a table on it & they had started using 1st differences to calculate the rate of change. I called all the groups over & led a discussion about the strategy and asked about what sort of deposit (a cost for 0 people) might have to be made by the teachers & sent all the groups back to continue, strongly urging them to explore the table idea. In 3rd period, none of the groups started the table, so I called all the groups over to some spare board & said “here’s something I saw in 1st period” & proceeded to have the same conversation with them.

Here are their boards:

This slideshow requires JavaScript.

We got to the point on day 1 where everyone solved for the cost for 150 guests. Time ran out, & bell rung.

Between periods 1 & 3 today I added some extra slides & questions to my slide deck to make it better.

Day 2:

Yesterday I added a slide asking students to graph the 3 points from the original data set in the original prompt. Today we started on that slide in Pear Deck :Screenshot 2017-10-13 at 3.54.27 PM.png
I asked them if this was linear or nonlinear. Why? In 1st period this also resulted in a conversation about 1st differences when the x values don’t have a constant increase.
I asked if the line of best fit would pass through the origin?

I then sent groups to their boards with the task of using Desmos to find the equation for the line of best fit . Their boards:

This slideshow requires JavaScript.

Once they had done a linear regression to find the equation, I asked them to use their equation to solve for the number of guests I invited if my party cost $3545 at the banquet hall. I coached a few groups through the proper format in which to show their work when solving an equation.

The rest of the period was dedicated to individual practice on a Khan Academy problem set called “Slope intercept equation from graph“.

Find the whole lesson here (the unassociated file is Pear Deck).

As a final note, this whole problem-based teaching can be hard for the student to grasp sometimes. Today this happened:

How do you handle it when students question your teaching skills or pedagogy? Let me know in the comments below!

– Laura Wheeler (Teacher @ Ridgemont High School, OCDSB; Ottawa, ON)


Running VS Walking Headstart #MPM1D #MFM2P #3ActMath

A month ago or so I read a post by Mr. Hogg about his Fast Walker activity. I thought it would be a great way to introduce linear systems graphically to my combined grade 9 math class before the end of the semester. I also did this activity with my Grade 10 applied students – next semester I’ll use it as an introduction to systems graphically with them earlier in the course.

What turned out to be super awesome is that a student in my grade 9 class just won gold at OFSAA last week! So I tweaked Mr. Hogg’s activity to use Joe’s winning data in our problem. I also structured the activity to be a 3 act math task. Here’s what we did:

Act 1: Notice – Wonder – Estimate

Runner Speed (1)

What do you know / notice?Capture

What do you wonder?Capture

If you want to cross the finish line at the same time as Joe, what distance head start will you need?Capture.JPG

Act 2: Measure & Solve

Capture.JPG

Students were told they had to stay in class when taking measurements; my idea being to force them to time themselves walking over shorter distances (the length of our classroom) and then use that to model their speed for this problem given. Each student had to calculate their own head start:

This slideshow requires JavaScript.

Act 3: Check & Reflect

We went out to our 400m track and students measured out their starting position. They staggered themselves according to their calculation (photo below – tried to take video but my phone battery died). Most students were around 100m before the finish line (~300m head start). We counted down & Joe started running & the class started walking. I so wish I’d gotten the video because it was awesome how close they all finished to each other!DB6mp2rXgAE8O55

I had my grade 9s graph their walk & Joe’s run on the same grid. Here are their graphs overlaid on top of each other:
Capture
Most students had the right idea, and I talked to a few with incorrect graphs individually but when I look at this overlay now I can see that I missed helping a few students correct their work 😦

We discussed which line was partial variation & which one was direct. I then introduced the language of “linear system” and “point of intersection”. My 2P class time to create an equation for each line also.

The next time I try this, I’d like to add an individual follow up question such as if you only had a 50m head start, at what distance would you & Joe meet? At what time would that be?

Here are my files for this activity (the unassociated one is the Pear Deck slideshow).

Tech Tip: Did you know you can add the same Google Doc/file to multiple folders without copying it? I didn’t until recently. It was useful for this lesson because I wanted to have it in the folder for each of the 2 classes I did the lesson with! Once you’ve clicked on the file just press Shift+Z :Capture.JPG

– Laura Wheeler (Teacher @ Ridgemont High School, OCDSB; Ottawa, ON)

Tree Height #3ActMath #MPM2D #MFM2P

Here is a tree height 3 act math activity I do for right angled trigonometry with both my 2D & 2P classes. The screenshots below were taken from my 2P class this semester.

Act 1: Setup

IMG_1636

Some noticings:IMG_2298

Some wonderings:IMG_2299

We do some turn & talk guesses for “too low” & “too high” then we go back to Pear Deck for our best estimate:IMG_2300

Act 2: Measure & Solve

Students downloaded a clinometer app onto one of the phones in their group.

Here are photos of last year’s group out measuring:

Up to the “vertical non-permanent surfaces” to solve in their “visibly random groups”:

This slideshow requires JavaScript.

Act 3: Consolidation

This is one activity I don’t have a true act 3 for – I don’t know the actual height of this tree 😦 I led a class discussion going over the solutions from various groups. We discussed the fact that trig would not find the whole tree height & that groups needed to add the height of the person up to eye level to their value found using trig. I sent groups back to their boards to adjust their solution for this (final photos above).

The whole activity, including the Pear Deck file, can be found here.

– Laura Wheeler (Teacher @ Ridgemont High School, OCDSB; Ottawa, ON)

#3ActMath – What is it?

I learned about a great tool this past weekend at the Ontario Summit; Adobe Spark video. A huge shoutout to Rushton Hurley for the introduction to this tool. It’s a super fast & easy way to combine photos, videos & text and narrate over top of it to create a seamless professional looking video.

I tried my hand and created one about the 3 Act Math lesson style made popular by Dan Meyer. Give it a watch & let me know what you think:

Update 2018.01.12: I made a sketchnote about 3 Act Math & listed some sites to explore the topic further & you can find it all here.

– Laura Wheeler (Teacher @ Ridgemont High School, OCDSB; Ottawa, ON)

Chicken & Goat Legs #MFM2P #PBL

Summary (scroll down for more details):2017.01.11 summary.png

Scenario:Capture.JPG

I asked some questions on Pear Deck to get students thinking about the parameters of the problem:

captureWe discussed some of the above responses that did not meet the criteria of a total of 70 legs and why.

Students went to their boards in their small groups to solve this problem:

She has 26 animals all together.
There are 70 chicken & goat legs all together.
How many chickens? Goats?

Most groups were very unsure as to how to proceed in their solving. Most were simply guessing & checking various pairs of numbers. After a few minutes of allowing that productive struggle, when I noticed frustration setting in for some, I asked if anyone had considered drawing animal bodies & assigning legs to them? Here are the student boards:

We returned to our seats and our Pear Deck session & I put it into student-paced mode. I asked them to create the equations for the various parameters of the problem: Capture.JPG
They struggled with this so I did some direct teaching about how to build the equation for this and the next slide:
capture

Students were asked to use Desmos to graph their 2 equations & then sketch the graph and point of intersection:capture

Students were asked to develop an algebraic solution using the elimination method:Capture.JPG
Not all of my students are comfortable with the algebra still (even though we’re at semester’s end now).

I like that we used 3 different methods of solving this problem; diagramming, graphing & algebraic. I want my 2P students to know they can always fall back on “less sophisticated” methods to solve these problems at evaluation time (as opposed to the algebraic solution).

The resources can be found here (including the Pear Deck interactive slideshow).

– Laura Wheeler (Teacher @ Ridgemont High School, OCDSB; Ottawa, ON)

Flight Costs #MFM2P

I’ve done this activity once previously. I changed how I did it for this second go. I will change it again for next semester.

Here’s how it went this time …

Students were presented with this data:copy-of-lr-flight-distance-vs-cost

Students were asked:

2016.12.21 notice.JPG

2016-12-21-wonder

The task for day 1: Determine the initial value & rate, on average, for flights with Air Canada.

Some groups went to Desmos straight away. Others needed some reminding that Desmos can be very helpful with data like this.

On day 2, groups were asked to determine the distance they could fly for $500 using their equations from the previous day. I only took a photo of one group’s board that day:2016.12.22 summary.png

I think next semester I will change this up. I think I will present the name of a city & ask students to estimate the cost of flying there. Then I’ll give them the set of data for cost & distance for multiple cities, but with the first city blanked out; perhaps allowing them to adjust their estimate if they like. We’ll do notice & wonder, and then proceed to solve for the price. I won’t specify modelling algebraically but will perhaps create a Desmos activity builder they can do to practice that in the case where they don’t use an algebraic model to solve.

Update: Find the Desmos activity builder follow-up here

Activity available here.

– Laura Wheeler (Teacher @ Ridgemont High School, OCDSB; Ottawa, ON)